
First Quarter 2025 Investment Commentary
USA Macro Winter and Global Macro Fall

Winter is Coming for the USA

When Does the USA Exit Macroeconomic Winter?
We will distill the underlying fundamental trends from the cauldron of distortions currently impacting the reported economic data. From there, we will detail the expected macroeconomic weather patterns in Q2 and discuss the interplay between monetary, fiscal, and trade policy and its likely magnitude of impact in the 2nd half of 2025.
When Does Global Macroeconomic Summer Top?
As international equity markets defy expectations, breaking free from an industrial recession, the global economic landscape stands at a critical crossroads. Will the global economic resurgence momentum begin to moderate?
The central question emerging is not just about market performance, but about understanding the precise moment when this global economic expansion will begin to transform—or potentially unravel.
The Timing of Trump Tariffs vs. Tax Cuts
Foreign policy objectives and corporate efficiency—or the common good?
Do trade deficits matter—and do the resulting capital inflows raise concerns about who “owns” America?
While there may be legitimate debate over the answers, the Trump administration’s position is very ambiguous. Its aim is to restructure American trade and industrial policy in a way that favors labor over capital—a shift that is likely to bring significant turbulence.
A key question now is whether a potential extension of the Trump-era tax cuts can boost consumer and business confidence enough to offset that turbulence through stronger spending and investment.
Finally, all of this is occurring on the stage of rising nationstate geopolitical tensions which serves as an amplification of the turbulence and divergences.
The Drakkar’s Performance and Positioning

The Drakkar: Our Multi Asset Class Long Short Longship
For a refresher on how we sail our managed portfolios, click here.
The Drakkar’s Performance
As a reminder, investing is just a means to an end.
That end is accomplishing your financial goals which are measured and mapped via your custom financial plan.

Every financial plan has inside of it a required return (RR) that must be earned over the long term for the portfolio to do its part in making the financial plan successful.
As such, we will compare how the managed portfolios have performed relative to their respective required return.
We will also compare the managed portfolios to a comparable diversified portfolio.
Aggressive Portfolios
Relative to the Required Return (RR)
For the quarter, our managed aggressive portfolios materially outperformed their RR benchmarks.
For the year to date, our managed aggressive portfolios materially outperformed their RR benchmarks.
—————————
Relative to Comparable Portfolio Benchmarks
For the quarter, our managed aggressive portfolios materially outperformed their aggressive portfolio benchmarks.
For the year to date, our managed aggressive portfolios materially outperformed their aggressive portfolio benchmarks.
—————————
Moderate Portfolios
Relative to the Required Return (RR)
For the quarter, our managed moderate portfolios materially outperformed their RR benchmarks.
For the year to date, our managed moderate portfolios materially outperformed their RR benchmarks.
—————————
Relative to Comparable Portfolio Benchmarks
For the quarter, our managed moderate portfolios materially outperformed their moderate portfolio benchmarks.
For the year to date, our managed moderate portfolios materially outperformed their moderate portfolio benchmarks.
—————————
Enhanced Cash Reserve Portfolios
Relative to Comparable Portfolio Benchmarks
For the quarter, our managed enhanced cash reserve portfolios materially outperformed their cash reserve portfolio benchmarks.
For the year to date, our managed enhanced cash reserve portfolios materially outperformed their cash reserve portfolio benchmarks.
—————————
Traditional Cash Reserve Portfolios
Relative to Comparable Portfolio Benchmarks
For the quarter, our managed traditional cash reserve portfolios were in line with their cash reserve portfolio benchmarks.
For the year to date, our managed traditional cash reserve portfolios were in line with their cash reserve portfolio benchmarks.
The Drakkar’s Positioning: The Equities
Performance
For the quarter, our equity returns were materially positive and materially outperformed the world equity benchmark.
The primary contributors to this outperformance were our exposures to
West Texas Real Estate where we own the land as well as the oil, gas, and water rights.
Global armament companies where we have material exposure to the European armament industry.
Moreover, much of the outperformance came from having a benchmark underweight to US Large Companies that are dominant in most equity indexes like Apple, Nvidia, Microsoft, Amazon, Tesla, etc which performed poorly over the period.
New Positions
A Capital Markets Exchange

We added an exposure to a leading capital markets financials exchange. It specializes in facilitating trading in derivatives, equities, and foreign exchange markets. Founded in 1973 as the first standardized options exchange, it revolutionized financial markets by introducing exchange-traded stock options, which replaced the fragmented over-the-counter markets of the time. Today, it operates the world’s largest options exchange by volume and serves as a hub for trading equities, futures, and digital assets across North America, Europe, and Asia-Pacific.
This company holds enviable economic margins with a near monopoly like business model and is reasonably priced while being largely immune from on again off again tariff policy.
The ever advancing march of technology and the greater access for everyday people to trade capital markets means more opportunities to monetize on greater trading volumes by more people and firms.
Moreover, it is a great compliment to the rest of the equity portfolio given its likely resiliency in the face of greater market uncertainty which might lead to even more revenues and profits if market participants choose to express their concern in greater trading of derivatives, equities, currencies, etc.
For the quarter, this position materially outperformed the world equity benchmark. The top contributors to this outperformance came from
A Defense and Aerospace Component Manufacturer

We added an exposure to a prominent global player in the military and commercial aerospace sector, specializing in the design, production, and supply of highly engineered aircraft components . With over three decades of experience, the company has established itself as a critical provider of essential parts for both commercial and military aviation. Its core business revolves around delivering components that are fundamental to the safe and effective operation of aircraft worldwide . A key aspect of their strategy is a focus on manufacturing highly engineered, proprietary components where it is often the sole-source supplier thus creating substantial barriers for competitors seeking to enter the market. Furthermore, the company's long-standing presence in the aerospace industry, spanning more than 30 years, indicates a wealth of accumulated knowledge and expertise in this highly regulated and demanding sector.
This company holds enviable economic margins with a near monopoly like business model and is reasonably priced.
Moreover, it is a great compliment to our existing exposure in global armaments as its economic margins are impressive and it is reasonably priced whereas much of the global armaments industry has short term future expectations priced so high it is likely to disappoint combined with the fact that many of them do not have as attractive economic margins.
For the quarter, this position materially outperformed the world equity benchmark.
The top contributors to this outperformance came from
A Multinational Military Technology and Armaments Manufacturer

We added an exposure to a one of the world’s largest military technology and armament manufacturers.
Its operations cover several key areas. These include space systems (satellites, launch vehicles, ground systems), mission systems (radars, sensors, surveillance, and cyber capabilities), aeronautics systems (manned and unmanned aircraft, including the B-21 Raider stealth bomber), and defense systems (missiles, missile defense, weapons systems, and related technologies). In essence, they provide high-tech hardware, software, and integrated systems that are critical for national security, intelligence gathering, and space exploration.
This company holds attractive economic margins with a very solid business model and is reasonably priced.
Moreover, it is a great compliment to our existing exposure in global armaments as its economic margins are impressive and it is reasonably priced whereas much of the global armaments industry has short term future expectations priced so high it is likely to disappoint combined with the fact that many of them do not have as attractive economic margins.
For the quarter, this position materially outperformed the world equity benchmark. The top contributors to this outperformance came from
Exited Positions
India
As the quarter progressed, we exited this position as the incoming top down #Macro began to indicate unfavorable macro economic weather patterns for this exposure and the bottom up #Quant from Mr. Market began to incrementally concur.
Maintained Positions
US Large Company Equity Exposure
We held this exposure whose foundation consists of US Large Companies and then seeks to earn superior long term returns with lower downside risk by quantitatively removing overvalued low quality companies run by poor management teams. For example, these negative factors that are filtered out include:
High External Financing: companies that are over reliant on external capital through high debt or stock sales.
Wealth Destroyers: companies that reinvest but generate economic returns below their cost of capital.
Value Traps: companies where intrinsic value is lower than book value; we avoid these potential value traps.
For the quarter, this position materially underperformed the world equity benchmark. The top three contributors to this underperformance came from
Global Armaments

We held this exposure which is one that focuses on companies that make armaments for nation state security.
With the rising trend of deglobalization (in favor of the far older and more common structure of regionalization) combined with a rising trend in nation state geopolitical conflicts while considering that armaments spending has largely fallen to such lows implying that nation state conflict was over, the potential growth path forward is far more likely than not.
While our deep dive (click here for more) into the state of armaments is the foundational reason for our exposures, the White House diplomatic incident between President Trump/Vice President Vance and Ukraine’s President Zelensky served as a bottom up validation of our thesis and Mr. Market has started to come around to similiar conclusions and thus is part of why European armament companies performed spectacularly well over the period.
In other words, it appears Europeans believe they have to be responsible for their own security and thus will attempt to rearm by growing their own industrial base and armament base at the expense of buying from American armament firms.

For the quarter, this position materially outperformed the world equity benchmark. The top three contributors to this outperformance came from
Rheinmetall AG (German Armaments)
Thales (French Armaments)
Saab (Swedish Armaments)
Japan Small Companies

We held this exposure whose foundation focuses on high quality and profitable small Japanese companies with active currency hedging. For a deeper dive into this topic, click here.
This means the fluctuations in the exchange rate between the US Dollar (USD) and Japanese Yen (JPY) are neutralized.
As US investors, our currency is the USD. This means if we own an asset denominated in another currency (like JPY) and if the USD gets stronger relative to the JPY that means the foreign asset we own has lost value all else equal purely due to the change in the foreign exchange (FX) rate.
The primary motivation for hedging the currency is based on our view that we find the price of and the economics of the underlying companies very attractive and don’t want currency exchange rate fluctuations to pollute the returns of the exposure.
For the quarter, this position marginally outperformed the world equity benchmark. The top three contributors to this outperformance came from
West Texas Real Estate

We held our exposures to West Texas Real Estate which is specifically in the highly energy productive Permian Basin where we own the real estate as well as the oil, gas, and water rights.
One of our exposures consists of approximately 870,000 acres of surface land and 2.4 million acres of mineral interests in West Texas, with a checkerboard pattern of land holdings that are effective for capturing tangential activity such as power lines, pipelines, and roadways. Moreover, this exposure is located in District 8 which is responsible for about 20% of all oil and gas production in the U.S.
Another exposure includes an additional 220,000 surface acres and 8,000 gross mineral acres in the Permian Basin, with a focus on contiguous land holdings that are ideal for large-scale water management and data center operations.
This offers unique advantages for data center operations (especially for AI focused workloads), including abundant and cheap natural gas for power generation, extensive water resources for cooling, an unregulated power grid, and low existing populations so there is little to no competition between citizens and business for access to said resources.
Finally, these exposures come with relatively low overhead costs, as these businesses do not engage directly in oil and gas production. Instead, it leases its land to producers, ensuring a steady flow of royalty income without the associated expenses and risks of production. An additional benefit is the potential for significant appreciation in the real estate itself over time, particularly as the value of energy resources increases. Furthermore, the continued development and infrastructure improvements in West Texas can enhance the land’s value.
For the quarter, this position materially outperformed the world equity benchmark. The top contributors to this outperformance came from
Digital Asset: Bitcoin

Yes we are aware Bitcoin (BTC) is not an equity but we assign it to the risk sleeve for risk management and portfolio management reasons.
We find the following characteristics of BTC very intriguing.
For a deeper dive into this topic, click here.
Scarcity: The fixed supply of 21 million coins provides a hard cap, unlike fiat currencies that can be inflated by commercial and central banks.
Decentralization: No single entity controls the BTC network, making it resistant to censorship and single points of failure.
Immutability: The blockchain's design makes it extremely difficult to alter past transactions, providing a secure and auditable record.
Portability: BTC can be easily transferred globally over the internet and can be self-custodied in a portable manner.
Censorship Resistance: Transactions cannot be easily blocked by governments or financial institutions.
Increasing Adoption: As more individuals, businesses, and even institutions adopt BTC, its network effects strengthen, and its utility as both a store of value and a medium of exchange grows.
These characteristics are especially attractive in the context of a world reversing from globalization back to regionalization with growing distrust between multiple layers of society (nations, central banks, governments, citizens, etc) and the historical temptation to print fiat money and thus debase purchasing power to facilitate societal restructuring.
For the quarter, this position materially underperformed the world equity benchmark.
The Drakkar’s Positioning: The Alternatives
Performance
Our alternative positions were materially positive for the quarter while world equities were materially negative and broad bonds were marginally positive.
As a reminder, the alternatives are designed to generate returns that are low to negatively correlated to both equities and bonds. For this quarter, they did exactly what they were supposed to do.
New Positions
None
Exited Positions
Quantitative Investment Strategies (QIS)
As the quarter progressed, we exited this position as the incoming top down #Macro began to indicate unfavorable macro economic weather patterns for this exposure and the bottom up #Quant from Mr. Market began to incrementally concur.
Maintained Positions
Trending Following Multi Asset Class Managed Futures
As a reminder, being “long” means you make money when prices rise and conversely being “short” means you make money when prices fall.
These strategies go long what is trending up and go short what is trending down using a quantitative multi model framework i.e. price, volume, volatility, etc.
The trends that can be harnessed include all the major asset classes of equities, bonds, commodities, and currencies.
Moreover, it was these strategies that materially protected our capital in 2022 when virtually every long only vanilla stock and bond investors got crushed.
The beauty of this investment style is the ruthless execution of its quantitive rules which means there is no psychological barriers to changing one’s mind and thus positions when the data says the world is changing.
In fact, the long term evidence of this strategy’s veracity is the human tendency to resist the recognition of real world change.
As of this writing, our updated positions are:

Long
Commodities: Gold, Live Cattle, Cattle Feeder, Coffee, Silver, Copper, Sugar, Platinum, Corn, Wheat, Palladium, Canola, West Texas Crude Oil, Gasoline, Cocoa
Bonds: US 2 Year Treasuries, Canadian 10 Year Treasuries, US 30 Year Treasuries, Canadian 5 Year Treasuries, US 10 Year Treasuries, 3 Month SOFR, 3 Month CORRA, Canadian 2 Year Treasuries
Currencies: None
Equities: None
Short
Commodities: Lean Hogs, Cotton, Soybeans, Soybean Meal, Natural Gas, Wheat
Bonds: None
Currencies: None
Equities: None
Furthermore, there is asymmetric value in these types of strategies in the context of an ultra low starting point of armament spending which leads to failed deterrence which leads to kinetic conflict which leads to a resurgence in armament spending as we discuss here.
For the quarter, this position materially outperformed both world equity and broad bond benchmarks. The top contributors to this outperformance came from
Long gold.
Long bonds.
Short commodities.
Gold Bullion

As a reminder, our gold exposure (which we helped get created) is the combination of two different strategies:
First, we get 1.5X exposure to the price of gold. For example, if the gold price goes up 10% then this exposure would be up 15%. Effectively, it buys $10 of gold with cash and then borrows the remaining $5 to buy the remaining gold position which results in a total exposure of $15. By borrowing funds as institutional investors in global capital markets, we are able to borrow at an interest rate in the low single digits. We are effectively borrowing a debasing fiat currency in the low single digits to buy a debasement resistant monetary reserve asset.
Second, we layer on the selling of put spreads to generate option income. This is akin to selling a fire insurance policy that lasts for 2 weeks before it expires for a price of $10 and then buying firestorm reinsurance for $1 thus pocketing $9 for the two week period. By renewing this “fire insurance policy” every two weeks we expect over the long term to generate a modest amount of additional income in a very prudent manner.
When these positions are combined we have effectively created a gold exposure that generates income which is boosted by prudently borrowing some rapidly debasing fiat currency to buy a debasement resistant monetary reserve asset.
Using our applied history framework, which we see as a practical tool that uses the laboratory of the past to better understand and navigate the complexities of the present and future, we observed that Gresham’s Law states “bad money drives out good money” i.e. people rapidly spend the less valuable money and hoard the most valuable money.
For example, you might spend fiat paper currency for food and then hoard your gold bullion.

We then molded that historical observation into an investment expression that is borrowing “bad money” to buy more of the “good money”.
Finally, at the 50,000 ft altitude of analysis, you will see that
Gold demand from global central banks is accelerating at the same time US Treasuries are being reduced.
Gold demand from global central banks intensely accelerated after the start of Russia’s invasion of Ukraine.
Gold exposure is being specifically expressed via physical deliveries which highlights growing mistrust.
The top global fiat currencies (USD, EUR, GBP, CHF, JPY, etc) have all lost material value relative to gold over the past several decades with the best performing fiat of the Swiss Franc (CHF) “only” losing 93% of its value.
Over the past 109 years, the gold supply has increased from 38,387 tones in 1914 to 212,582 tonnes in 2023 which is an annualized increase of 1.59% per year which favorably compares to the USD supply of 26 billion in 1914 to 212,582 billion in 2023 which is an annualized increase of 8.61%.


Source: World Gold Council, Incrementum AG, Reuters Eikon, USGS, Federal Reserve St Louis
For the quarter, our returns in our gold positions materially outperformed while the world equity benchmark was marginally negative and broad bonds were marginally positive.
The Macro Situation Report

For a refresher on our analytical framework, click here.
When Does the USA Exit Macroeconomic Winter?

Unfortunately, political bias has intensified and is polluting all traditional soft survey indicators.


Source: University of Michigan, Hedgeye Risk Management
It does not help that methodology changes are compounding the noise of the political bias. The variation in responses (measured in standard deviations on the chart below) spiked when the traditional phone interview transitioned to partly web based and went vertical when the survey went to fully internet based. Clearly, respondents are more inclined to give outlier responses when the interviewer is not present to give guidance or offer soft pushback.


Source: Census Bureau, Hedgeye Risk Management
Additionally, the divergence between hard and soft data continues to widen which means any indicator that incorporates soft data is laced with high amounts of political bias and thus can pollute one’s conclusions.

Source: Hedgeye Risk Management
Speaking of hard data, we have seen multiple instances of proactive import and inventory management over the past year with the port strikes mid-year and tariff front-running into year end. The increase in consumer goods and durables imports/purchases ahead of prospective tariff impacts is evident in the 4th quarter data. This likely represents a time-shifting in activity that may add distortion to the reported growth data from a GDP accounting perspective.


Source: Census Bureau, Hedgeye Risk Management
We likely saw demand shift in the recent Auto Sales data for March (+11% MoM, +14.7% YoY) which will bolster reported Retail Sales and Consumption growth to close 1st quarter. Collectively, the distortions will impact GDP accounting in Q1 2025 and serve as a drag on reported growth in Q2.


Source: Bloomberg, Factset, Hedgeye Risk Management
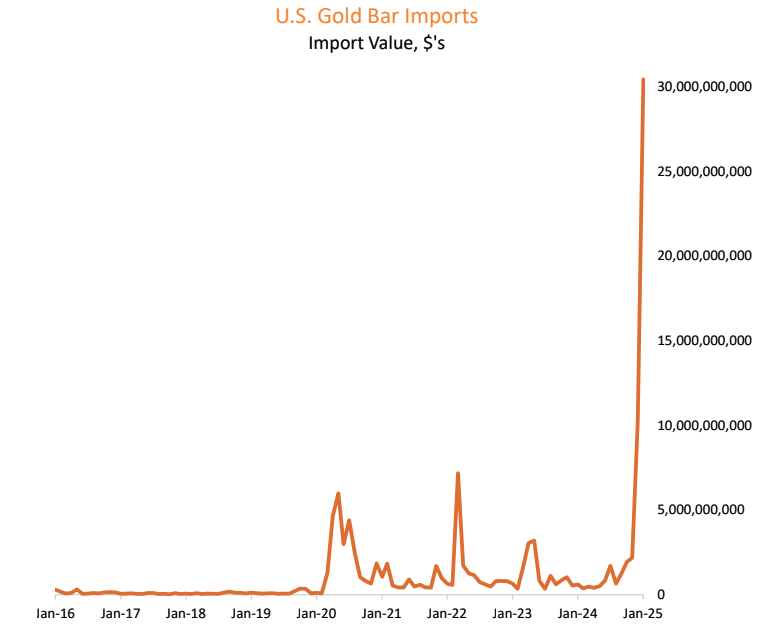
The Tariff front-running and policy related gold demand and arbitrage dynamics have turbo juiced imports and massively amplified the trade imbalance – a short-term, large-scale distortion that will impact reported data from a growth accounting perspective.
This makes determining the underlying domestic growth trend very difficult so much so that the Atlanta Federal Reserve nowcast below is totally not confusing in any way and makes things totally clear.


Source: Bloomberg, Factset, Atlanta Fed, Federal Reserve, Hedgeye Risk Management

On top of this is the observation that corporate profits are the highest ever. This is of course very beneficial to those who are owners of capital and financial assets. Additionally, margins saw an expansion in the post pandemic environment. The next question is how much would be negatively impacted by tariffs.


Source: Bloomberg, Hedgeye Risk Management
We continue to see that despite the sharpest rate hiking cycle ever that net interest payments paid by big corporations have fallen to the lowest ever.

Source: Bloomberg, Hedgeye Risk Management
Households for their part have expectations of rising unemployment and lower stock prices over the next year. They also see their real incomes falling to all time lows and their financial situation to change in a materially negative way. Additionally, households expect to see a material increase in the probability of debt delinquencies on their mortgages and autos.

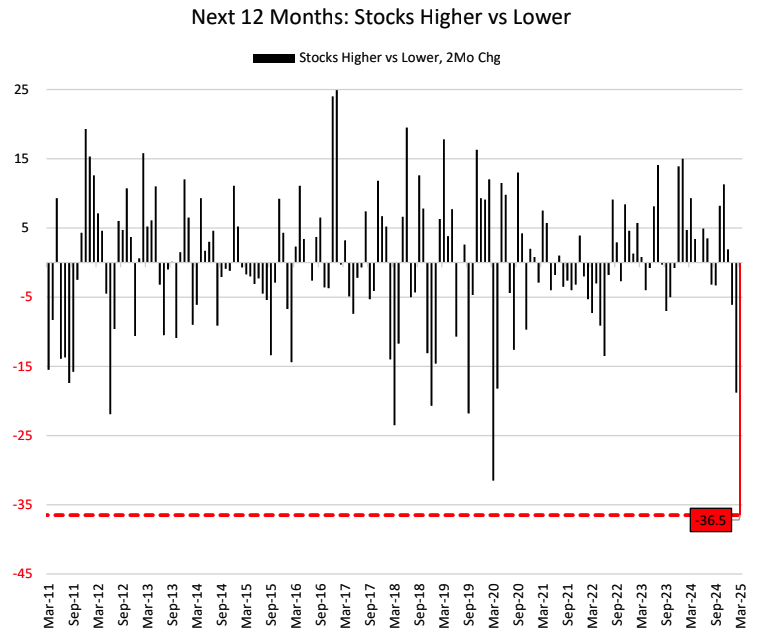


Source: University of Michigan, Bloomberg, NY Fed, Hedgeye Risk Management
On the housing side, unsold single family homes are now at the highest level since the great financial crisis (GFC).


Source: Census, Bloomberg, Hedgeye Risk Management
Moreover, we must note that changes in government policy on immigration and tariffs heavily impact housing since the variables of labor and materials account for approx 60% of construction costs.
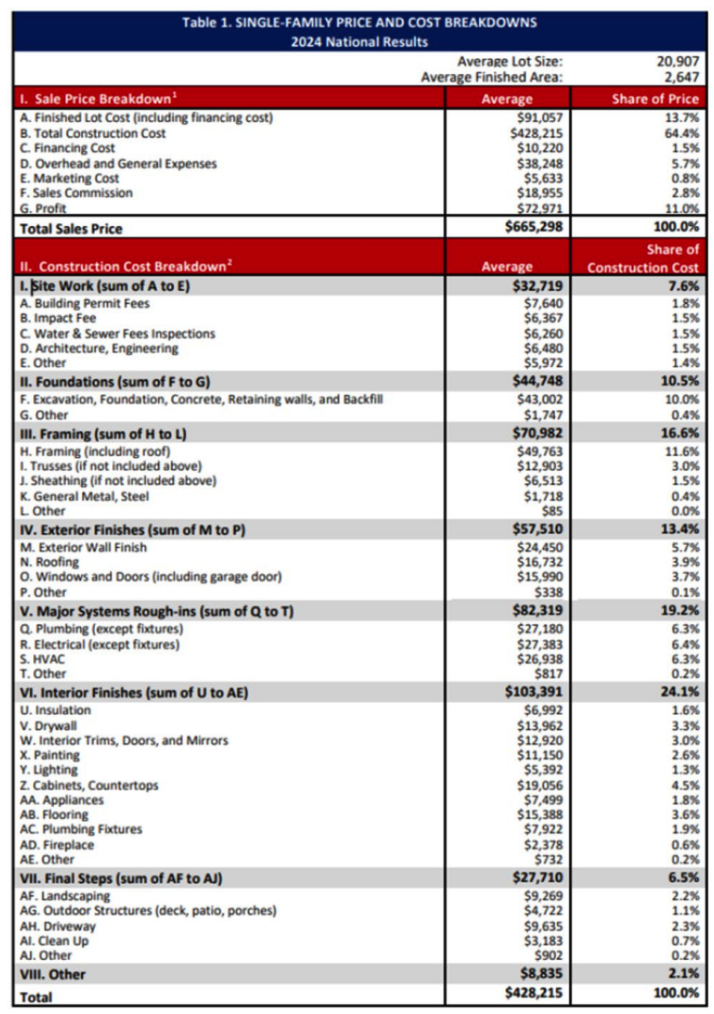

Source: Census Bureau, NAHB, Hedgeye Risk Management
Furthermore, Canada and Mexico account for about 50% of wood and 30% of construction metal imports.


Source: Bloomberg, Hedgeye Risk Management
Finally, immigrants represent about 25% of workers in construction and more than 30% of craftsmen/trades workers. Note the wide geographic variation and that the highest immigrant worker concentrations are in the largest new construction markets (TX, FL, etc).

Source: NAHB, ACS, Hedgeye Risk Management
Unsurprisingly, economic uncertainty is the highest ever. Job Cut announcements spiked to highest level since the GFC outside of the pandemic. This goes for trade policy as well.


Source: Bloomberg, Hedgeye Risk Management
It is a significant observation that the selling of US Equities by foreign official institutions (central banks, sovereign wealth funds, etc) was the largest on record. Furthermore, the relative outperformance of Non US Equities was also some of the highest on record.

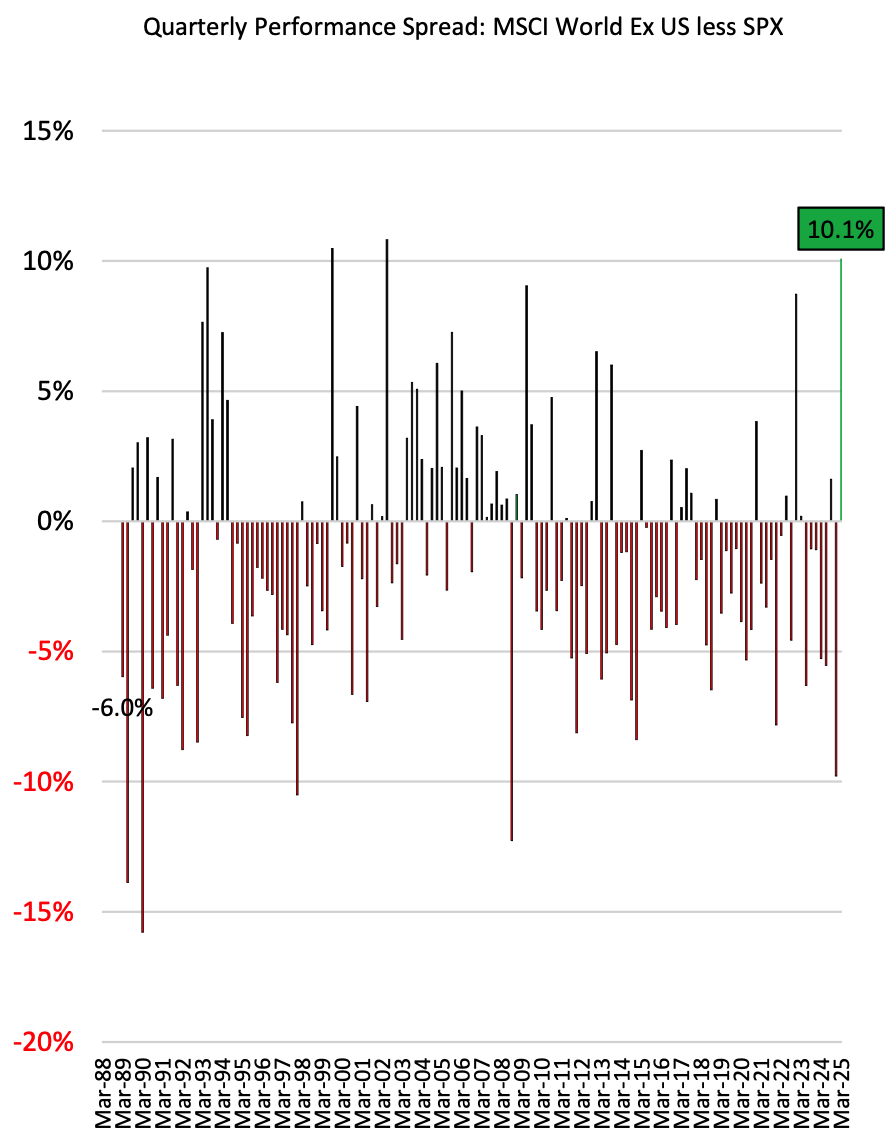


Source: Bloomberg, Hedgeye Risk Management
Effectively, this looks like Europe responding to US protectionist policy with its new primary directive to fund its own security. This results in capital outflows out of the US and into Europe which quickly moves prices as seen in European stock performance relative to the US which coincides with the strengthening of the EUR relative to USD (selling USD assets to buy EUR assets).
This is of course the 1st order effect in this current moment. The EU cannot borrow/spend without limit and without consequence. At some point this deficit spending would negatively impact the EUR relative to USD.


Source: Bloomberg, Factset, Hedgeye Risk Management
On the job front, the slowdown in hiring has slowed the transition from unemployed to employed, making job finding more difficult. Additionally, the DOGE impact is hazy as the target government job reductions are about 800,000 but it will likely be choppy as lawsuits, injunctions, reinstatements and other disputes slow down or reverse government job reduction.


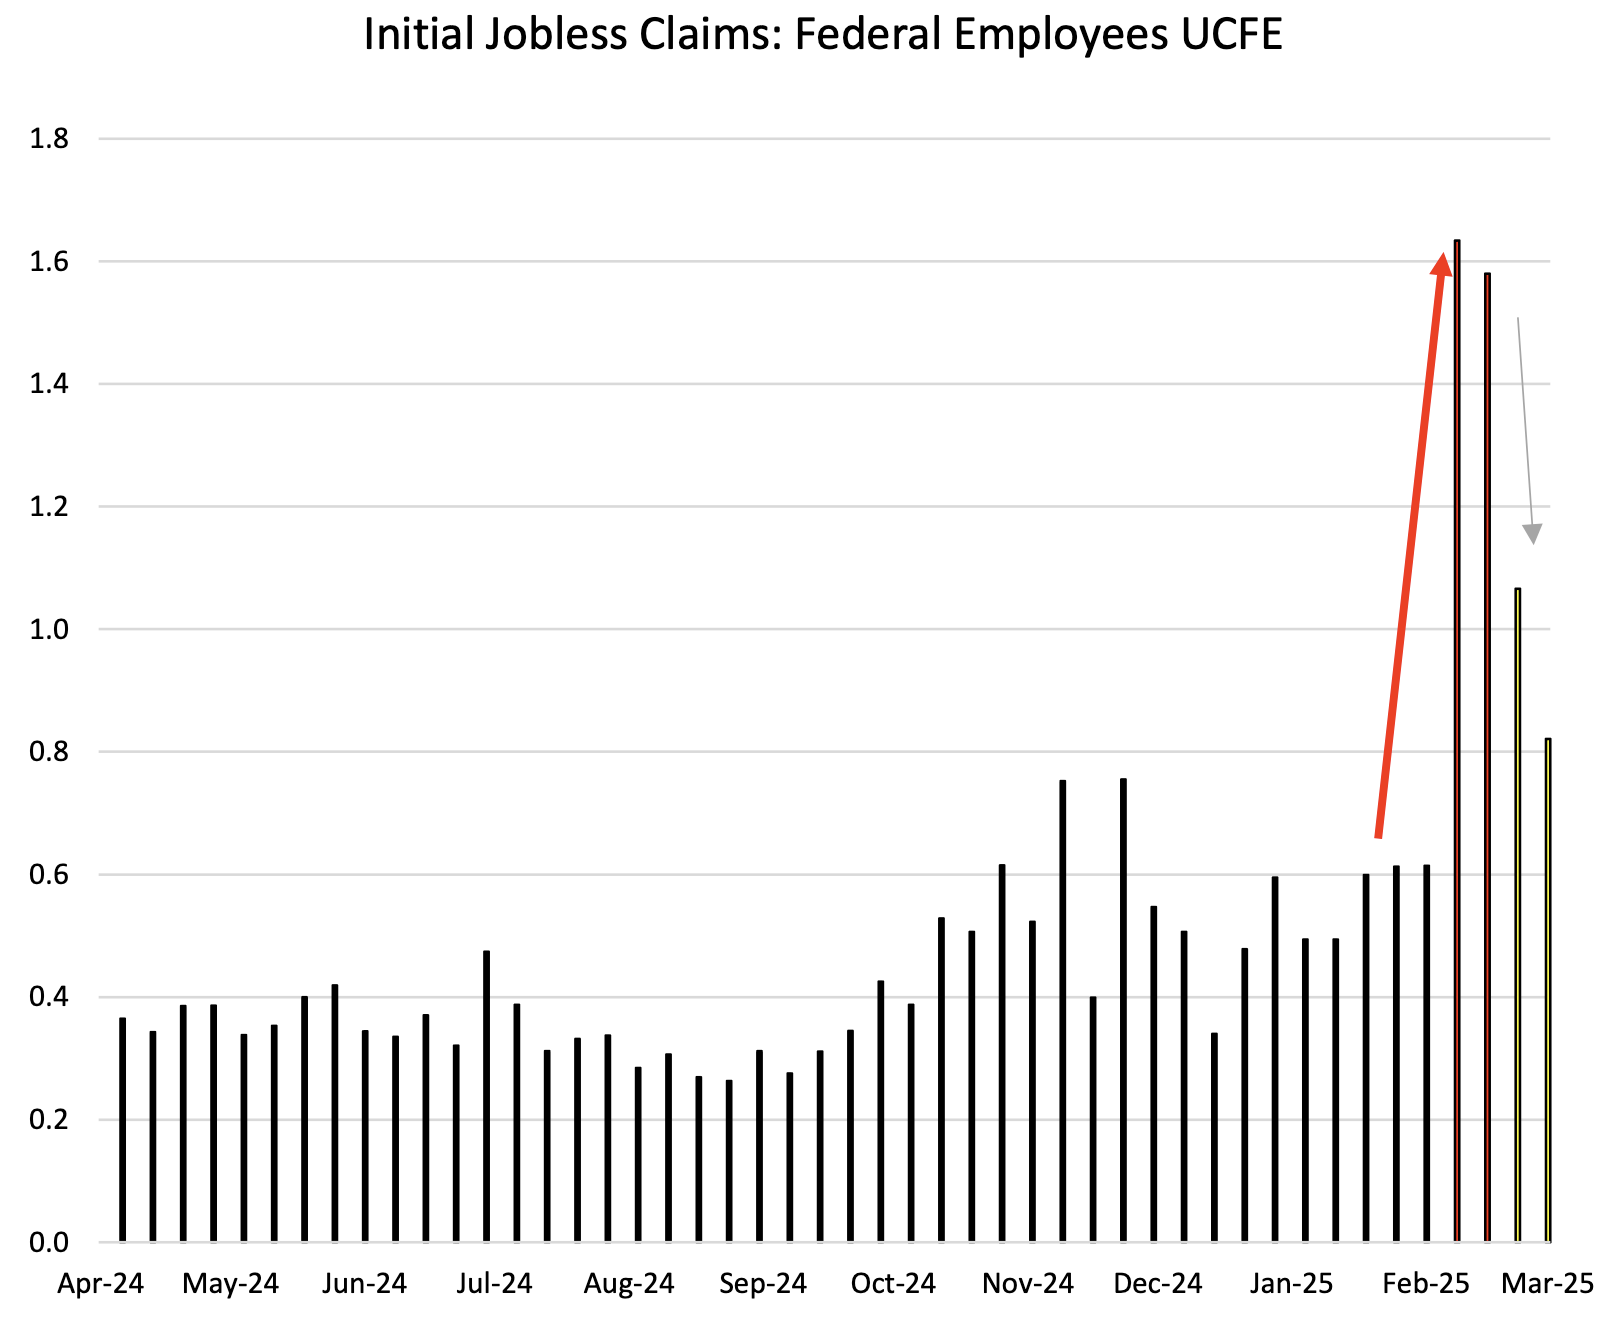

Source: BLS, Factset, Bloomberg, Hedgeye Risk Management

Source: layoffs.fyi, Reuters, Hedgeye Risk Management
Unsurprisingly, the most concentrated impact appears to be in Washington DC.


Source: Bloomberg, NAR, Hedgeye Risk Management
Lest we forget, for the past few years much of GDP was boosted by large scale immigration and government spending.


Source: Bloomberg, Census Bureau Vintage 2024 Population Estimates (released Dec 2024) , Hedgeye Risk Management
Going forward, federal government employment will likely slow and immigration trends have collapsed. This combination of lower immigration and lower labor supply means net monthly job gains will likely be lower which doesn’t on its own raise unemployment. Still, it will be weak and it will approach the tipping point of contraction. Overall, this should result in slowing consumer income and spending growth.


Source: Bloomberg, Census Bureau Vintage 2024 Population Estimates (released Dec 2024) , Hedgeye Risk Management
The strongest rate of change impact is likely in the federal government employement’s “shadow workforce”. The federal government ex-post office workforce is only 2.3 million but the number of contract and grant employees supporting this direct federal workforce is about 3.6 “shadow workers” per direct federal government worker.


Source: Brookings, Nick Taborek, Nations Analytics, Hedgeye Risk Management
This combination of DOGE, federal expansion DETOX, and varying degrees of deportation results in a material headwind to employment which leads to lower payroll growth which leads to lower aggregate wage income growth which means a deceleration in consumption ability.


Source: Bloomberg, Hedgeye Risk Management
Meanwhile, there was broad credit score inflation as student loan borrowers in delinquency/default in 2019 were marked “current” alongside loan forbearance initiatives. After recurrent delays, the onboarding grace period ended in Q4 2024. Now more than 9 million borrowers are expected to be marked newly delinquent in the first half of 2025 with an expected average credit score hit of -141 points. With many borrowers expecting student loan “forbearance” to transition to “forgiveness”, households with student loans spent more and took on other incremental debt during the student loan moratoria.


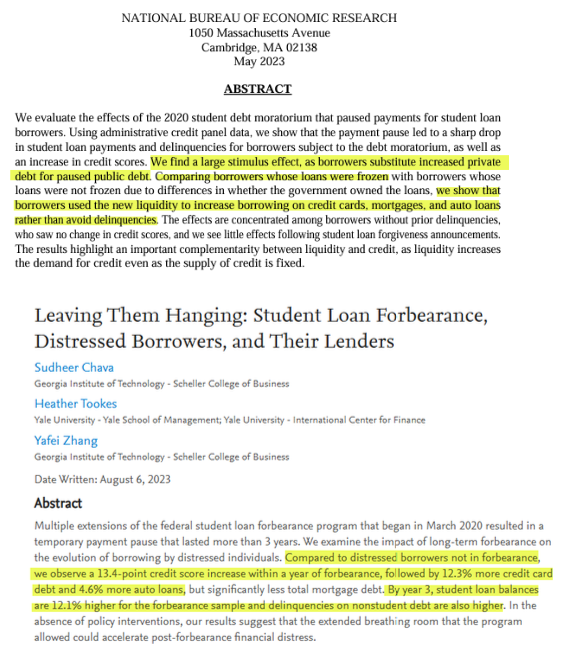
Source: NY FED, creditkarma, Intelligent, Transunion, Federal Reserve, Hedgeye Risk Management
The official data has not been released yet, but the figures below represent the “shadow delinquency rate” estimated by the NY Fed using Transunion and other proprietary data. This suggests the real delinquency rate is up, the real credit scores are down, the real cost of credit is up, the real access to credit is down, and ultimately discretionary consumption should go down.


Source: NY FED, Hedgeye Risk Management
This leaves us with the question if we are to expect relatively more tailwind or relatively more headwind. A large cross-section of the post-election tailwinds have moderated or (more than) fully retraced. There is no shortage of (mostly soft/survey) data that show a wind pattern similar to the below. CAPEX spending down, CEO confidence down, Compensation plans down, etc.


Source: Factset, NFIB, Hedgeye Risk Management
More specifically, a macro fall weather pattern appears to be forming which is a deceleration in growth rates and an acceleration in inflation rates. In fact, tariffs are likely to reinforce this weather pattern.


Source: Factset, Bloomberg, Richmond Fed, Census Bureau, Hedgeye Risk Management
Now, let us explore the world’s main regions to assess if global macro summer is still on the horizon.
When Does Global Macroeconomic Summer Top?

From a currency momentum perspective, Europe and South America stand out as out-performers vs. the Rest of World (RoW) with the Asia Pacific Region throwing off mixed signals.

Source: Hedgeye Risk Management
From a central bank rate policy perspective, we are seeing most countries cutting rates or about to begin a rate cutting cycle after holding rates flat (Japan and Brazil are the outliers raising rates).

Source: World Central Banks, Hedgeye Risk Management
If we zoom in on Germany, Industrial Production is getting less bad and approaching a positive inflection point. Effectively, things tend to get less bad before they start getting better. Additionally, Retail Sales just hit their highest level since Q1 2011. Moreover, business expectations are improving alongside consumer demand. The former headwind of rising inventory levels amid slowing demand appears to be reversing.


Source: Bundesministerium fur Wirtschaft und Arbeit, German Federal Statistical Office, Zew, S&P Global, Hedgeye Risk Management
Of course, we must not forget what the central banking authorities are doing in regards to monetary policy. The ECB is cutting rates and slowing their balance sheet run off. Moreover, M2 money supply growth has been accelerating over the past 12 months.


Source: European Central Bank, Hedgeye Risk Management
Mr. Market also seems to be confirming macroeconomic summer for the Eurozone. Poland is especially doing well as it appears there is a growing likelihood of a pause in the conflict between Russia and Ukraine.
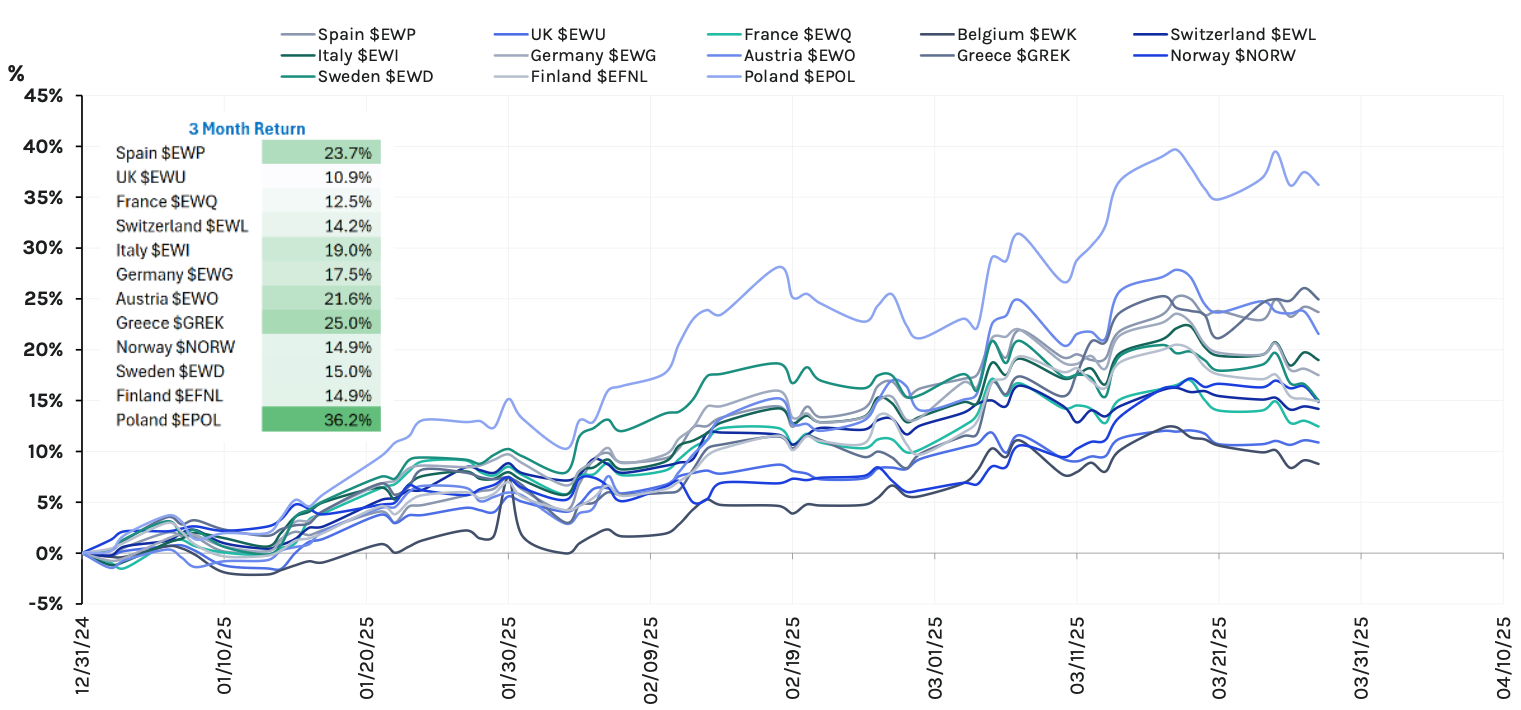


Source: Government Statistic Agencies, NYSE, Hedgeye Risk Management
As a reminder, when Russia invaded Ukraine again commodities were up between 50% and 100%. This echoes what we see thru history here. Now that a pause in the conflict is growing in possibility, we see a materially reversal which again echoes what we see thru history. This rapid increase and then rapid decrease is very apparent in dutch natural gas.


Source: CBOE, Green Markets, Eurostat, Hedgeye Risk Management
Now, let us examine the question of tariffs.
The US imports vulnerable to retaliation include but are not limited to steel, aluminum, and Venezuelan Oil.

Source: American Iron and Steel Institute, US International Trade Administration, Hedgeye Risk Management
As such, watching world export prices will show any signs of inflation before it arrives on US shores.

Source: Ministry of Trade, Industry and Energy, Hedgeye Risk Management
We must be cognizant that demand will find new sources for the same or different supply. Why?
Countries will find new sources for their products.
Countries will also find ways to mask their exports thru other countries.
Trade then shifts between countries and new relationships will get formed.
Case in point: Vietnam
Companies rushed to avoid US tariffs by ramping up production into Vietnam’s exports.
From 2017 to 2020, Vietnam exports to the US increased by 158% with a 40% increase in sectors hit by the 25% US tariffs (Chinese apparel, footwear, and furniture).
This is especially important in relation to China since its exports are large and diverse. What we see in the data is that exports from China to the Western world have already started to decline from their highs while starting to increase to Taiwan and Vietnam. For some, these changes in trade routes are quite significant relative to their GDP like Vietnam or Singapore.


Source: World Trade Organization, Reuters, International Monetary Fund, OEC Customs General Administration PRC, Government Statistics Agencies, Hedgeye Risk Management
We must not overlook the semiconductor exposure of the Asia Pacific Region as Taiwan exports to the US have greatly outpaced Taiwan exports to the Rest of the World. However, these relatively strong exports have slowed into February 2025 which saw a very large spike which represents companies front running orders ahead of tariff announcements. Thus, the most likely losers from US tariffs on semiconductors are likely to be Taiwan and Malaysia since the US is less dependent on semiconductors from South Korea and China.


Source: Central Bank of the Republic of China (Taiwan), Ministry of Trade, Industry and Energy, Hedgeye Risk Management
The Timing of Trump Tariffs and Tax Cuts
To better understand the impact of Tariffs, it is helpful to understand the reasoning behind the current system.
The current system centers around the idea of mutual gains from trade.
David Ricardo’s Theory of Comparative Advantage (1817)
Core idea:
Countries should specialize in producing goods they can produce relatively more efficiently (even if they’re worse at producing everything), and trade for the rest.
Key points:
Trade is beneficial even if one country is less efficient across the board.
What matters is opportunity cost—not absolute productivity.
Specialization based on comparative advantage leads to greater total output and mutual gains from trade.
Example:
England is better than Portugal at making cloth and wine, but...
England is especially better at making cloth.
Portugal gives up less to make wine than cloth.
So: England should make cloth, Portugal should make wine, and they should trade.
This theory became the bedrock of classical free trade economics.

Source: CFB World Trade Monitor, Hedgeye Risk Management
In theory, there is no difference between Theory and Practice.
In order for the theory to hold, the following assumptions are held:
Two Countries, Two Goods
The model assumes only two countries producing and trading two goods.
Labor Is the Only Factor of Production
Labor is the sole input—no capital, land, or technology.
Each good is produced using a fixed amount of labor per unit.
Constant Returns to Scale
Doubling labor input results in double output—no economies or diseconomies of scale.
Full Employment of Resources
All labor is fully and efficiently used in both countries—no idle resources.
No Transportation Costs
Trade is frictionless; shipping goods between countries has zero cost.
No Trade Barriers
No tariffs, quotas, or restrictions—free trade is assumed.
Perfect Labor Mobility Within Countries, but Not Between
Workers can move freely between industries within a country, but not across borders.
Technology Is Fixed and Different Between Countries
Each country has a fixed productivity level (labor hours needed per good), and it differs across countries.
These differences drive comparative advantage.
Countries Specialize Based on Comparative Advantage
Each country will fully specialize in producing the good for which it has a comparative advantage.
Outside of the theory and the limitations of its assumptions, we must not forget that many times trade policy and thus corporate interests are not in the driver’s seat but rather are the passengers to the driver that is the sovereign’s foreign policy objectives.
The Driver: US’s Foreign Policy Objectives
U.S. trade policy has been shaped by broader foreign policy objectives—promoting alliances, containing rivals, spreading influence, or rewarding strategic partners.
Marshall Plan (Post–WWII, 1948–1951)
Foreign Policy Goal: Rebuild Western Europe to prevent the spread of communism and strengthen allies.
Trade Policy Outcome: U.S. provided over $12 billion (over $100 billion in today's dollars) in aid—much of it tied to purchasing American goods.
Cold War Trade with Allies (1950s–1980s)
Foreign Policy Goal: Contain the Soviet Union and support non-communist allies.
Trade Policy Outcome: Japan, South Korea, Taiwan, and West Germany were given preferential trade access to the U.S. market to support their economic growth and political alignment. In contrast, strict export controls (under CoCom) were placed on high-tech goods to the USSR and its allies.
China’s MFN Status and WTO Entry (1990s-2001)
Foreign Policy Goal: Integrate China into the global system to encourage economic liberalization and political moderation.
Trade Policy Outcome: China was granted Most Favored Nation (MFN) trading status and the U.S. supported China’s accession to the World Trade Organization (WTO) in 2001.
NAFTA (1994)
Foreign Policy Goal: Promote stability and development in Mexico and Canada, strengthening regional ties.
Trade Policy Outcome: NAFTA was seen as a way to anchor Mexico economically and politically to the U.S. orbit post-Cold War.
Trade Restrictions As A Deterrent (Today)
Foreign Policy Goal: Deter aggression, nuclear proliferation, or human rights abuses.
Trade Policy Outcome: Use of sanctions and export controls on countries like:
Iran (nuclear program).
Russia (Ukraine invasion, election interference).
Cuba, North Korea, Venezuela (political regimes).
Promoting Tech Leadership and National Security (Today)
Foreign Policy Goal: Maintain tech leadership and counter the rise of geopolitical adversaries like China.
Trade Policy Outcome:
Tariffs, export controls, and blacklisting firms like Huawei for national security concerns.
Recent CHIPS Act and restrictions on AI chip exports to China.
The Passenger: US Corporate Interests
Moving technology and capital – particularly in labor-intensive industries – overseas in pursuit of lower unit labor costs has helped reduce the costs of production and deliver cheaper goods to consumers.

Source: BLS, Hedgeye Risk Management
Since the 1960’s, net imports have increased by 57x i.e. 6.4% per year in comparison to the 6.7x increase i.e. 3% per year in GDP.


Source: BEA, Hedgeye Risk Management
Ultimately, Trump Administration 2.0 has initiated a material change in the foreign policy and thus the trade policy which has the effect of reordering the priority of benefit for the US population. More specifically, US labor is being put into the front passenger seat and US corporates (and their shareholders) are being put into the back seat.
It is critical to understand that the prior trade policy had US corporates in the front seat and US labor in the backseat. We can absolutely see this in the data.


Source: BEA, Hedgeye Risk Management

Source: BLS, CDC, Social Capital Project (September 2019), Hedgeye Risk Management
A consequence of the material US trade deficit meant that trade surpluses built up by other nations were recycled into US asset markets.

Source: BEA, Hedgeye Risk Management
This starting point of large foreign ownership of US assets which are a result of large accumulated capital surpluses which are a result of large trade deficits which are a result of the previous trade policies which are a result of the previous foreign policies are critical when considering Trump Administration 2.0 has had a strong ideological motivation over a long period of time on reversing the magnitude of large trade deficits.


Source: New York Times, ABC, Fortune, Hedgeye Risk Management
Let us start quantifying the largest origins of the trade deficits. The “Big 4” (China, Mexico, Vietnam, Ireland) drive 49% of the US Trade Deficit. The “Big 5” behind them (Germany, Taiwan, Japan, South Korea, Canada) drive a further 25% of the US Trade Deficit.


Source: World Population Review, Hedgeye Risk Management
China
From 1985-1994, the total US/China Trade Deficit was $100 Billion. In the three decades since (mostly post 2001 WTO Accession), the total Trade Deficit has reached $7 trillion i.e. a 23x increase.
Mexico
From 1985-1993, the total US/Mexico Trade Deficit was $10 Billion. In the three decades since NAFTA (1993), the total Trade Deficit has reached $1.9 Trillion, a 60x increase.
Europe
From 1997-2024, the total US/Europe Trade Deficit has reached $4 Trillion, with recent trends running in the Quarter-Trillion annual range vs $20-30Billion annual range ~30 years ago, a 10x increase.
Canada
From 1985-1993, the total US/Canada Trade Deficit was $100 Billion. In the three decades since NAFTA (1993), the total Trade Deficit has reached $1.2 Trillion, a 4x increase.


Source: Census, Hedgeye Risk Management
Ultimately, the Trump 2.0 plan is for pain first followed be reward later.
The pain from DOGE cuts and trade realignments will occur first with the hope that it can be blamed on the past administration and then 2026 becomes a tax cut fueled reacceleration into the mid terms.
If the tariff revenue is material it can solve for a big part of the tax cut math.
This is of course the plan which doesn’t mean it will be the result.
Many times, plans change because someone else or something else forces a change upon you.
If there was ever a time to be onboard the Drakkar that can go both long and short across equities, bonds, currencies, and commodities while crewed by a team that is macro and historically aware, it is now.

The information in this document is provided in good faith without any warranty and is intended for the recipient’s background information only. It does not constitute investment advice, recommendation, or an offer of any services or products for sale and is not intended to provide a sufficient basis on which to make an investment decision. It is the responsibility of any persons wishing to make a purchase to inform themselves of and observe all applicable laws and regulations.