Q2 2026 Market Commentary
Schrodinger's Ceasefire

Market Performance
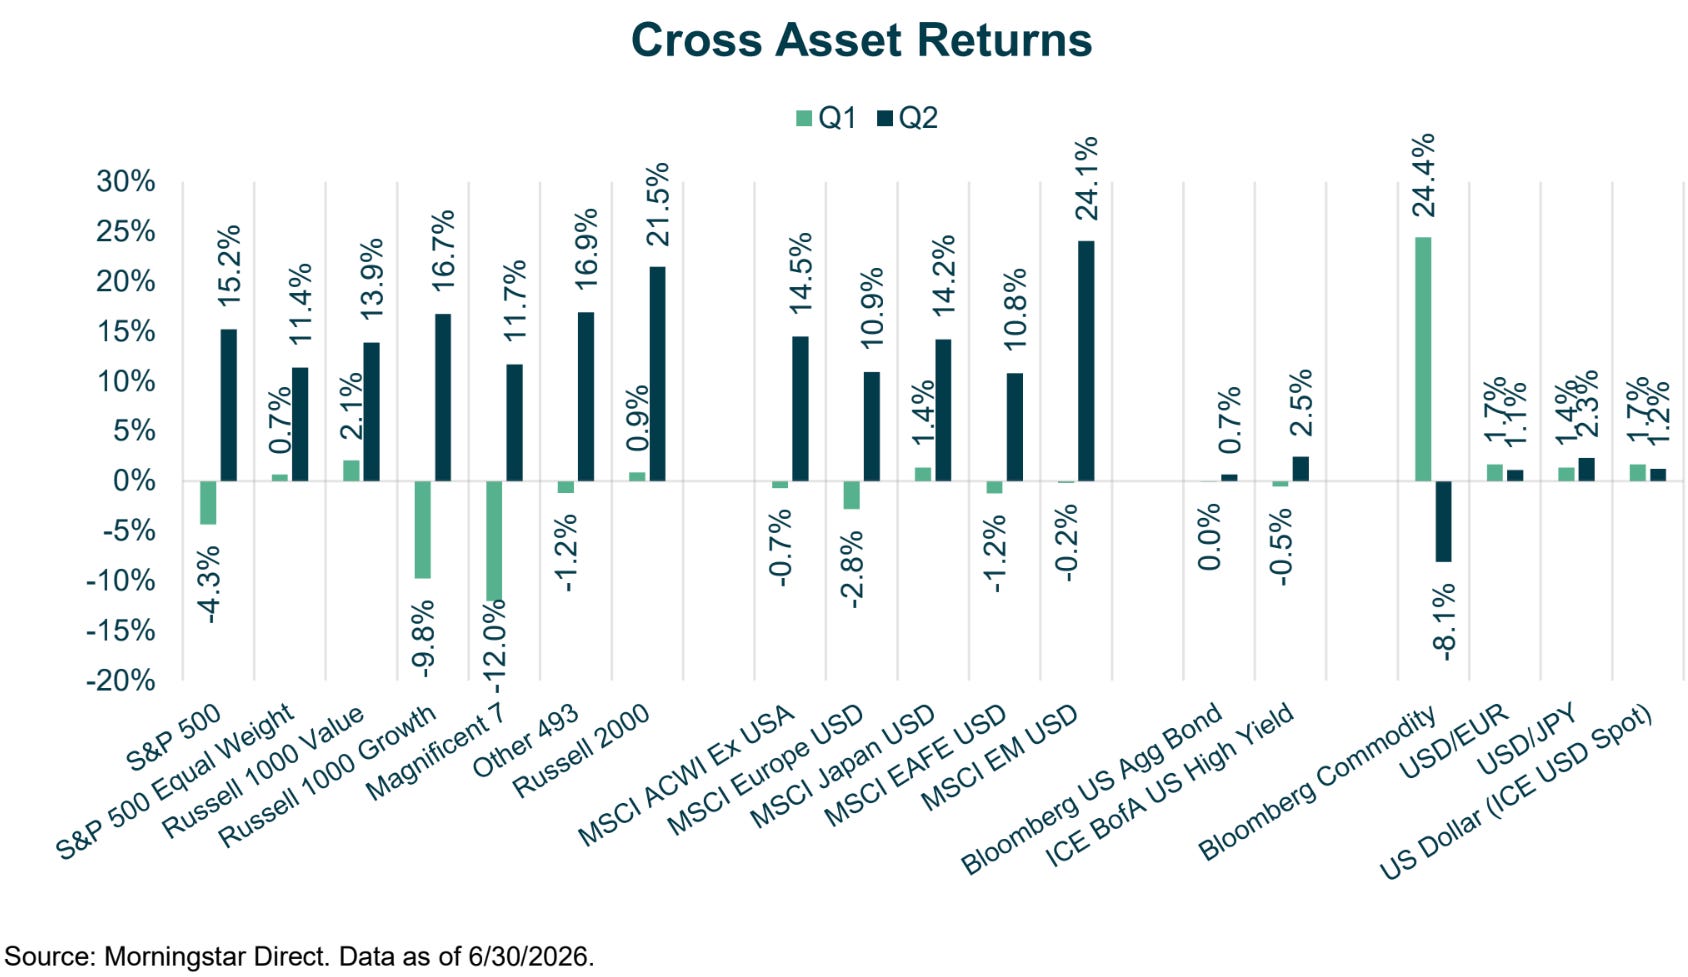
In Q1, the S&P 500 fell 5%, energy rose nearly 38%, and software fell 24%. Fears that a prolonged Strait of Hormuz closure could push oil to $200/barrel revived stagflation worries, combining higher inflation with slowing growth from increased energy costs.
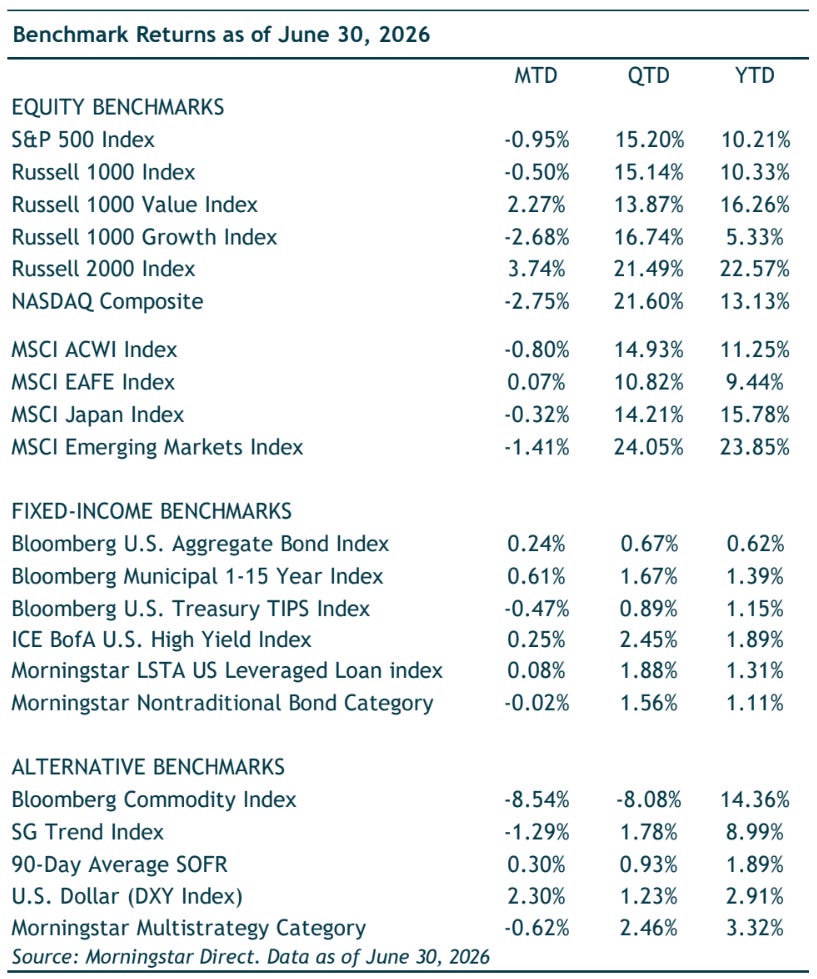
Q2 brought a round trip for risk assets. The S&P 500 gained 10.5% in April, its best month since 2020, and added 5.3% in May to hit successive record highs. The rally extended into early June with a record close of 7,609. Despite a choppy June, the index gained 15.2% for the quarter and is up 10.2% year-to-date.
Following a nearly uninterrupted ascent in April and May, with the S&P 500 logging nine consecutive weekly gains, June shifted course. The market grappled with two tech-led drawdowns, volatile Middle East peace talks, and a Federal Reserve meeting that disappointed doves.
Despite a three-year high in the inflation rate, a more hawkish Federal Reserve, and an unresolved war, equities hit record highs. This forward-looking market rally wagered that the worst of the energy shock had passed and corporate earnings would continue growing. While this bet may prove correct, questions regarding the direction of interest rates, inflation, and geopolitical conflicts remain unsettled.
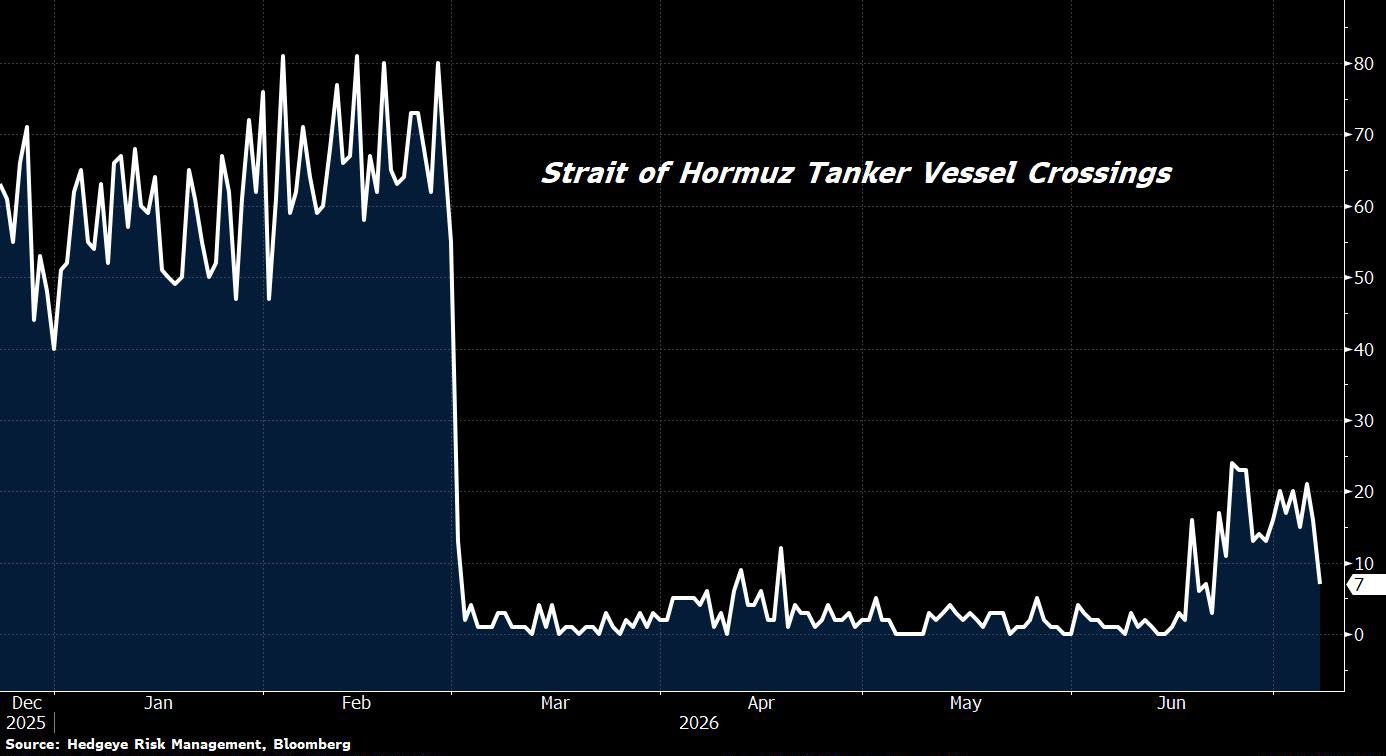
For example, Strait of Hormuz tanker crossings have not recovered to prewar levels.
The quarter was notable for challenging the narrative of a narrow, top-heavy market. While mega-cap tech dominated through May, market participation broadened significantly in the final weeks. The equal-weighted S&P 500, value, and small-cap stocks all outperformed the capitalization-weighted index. In June alone, the Russell 2000 gained 3.7% (up 22.6% for the first half), and the Russell 1000 Value Index outperformed growth by nearly 5%, reaching a 16.3% year-to-date return. Ultimately, a broadening market reflects a much healthier upward climb.
The rotation extended to foreign equities, led by emerging markets. Driven by semiconductor and memory demand in Korea and Taiwan, the MSCI EM Index gained roughly 24% in Q2. Developed international markets logged solid absolute returns but lagged other equities; the MSCI EAFE Index rose about 10.8%, European stocks gained nearly 11%, and Japanese equities surged 14.2%. A stronger U.S. dollar slightly dampened these foreign returns in dollar terms.
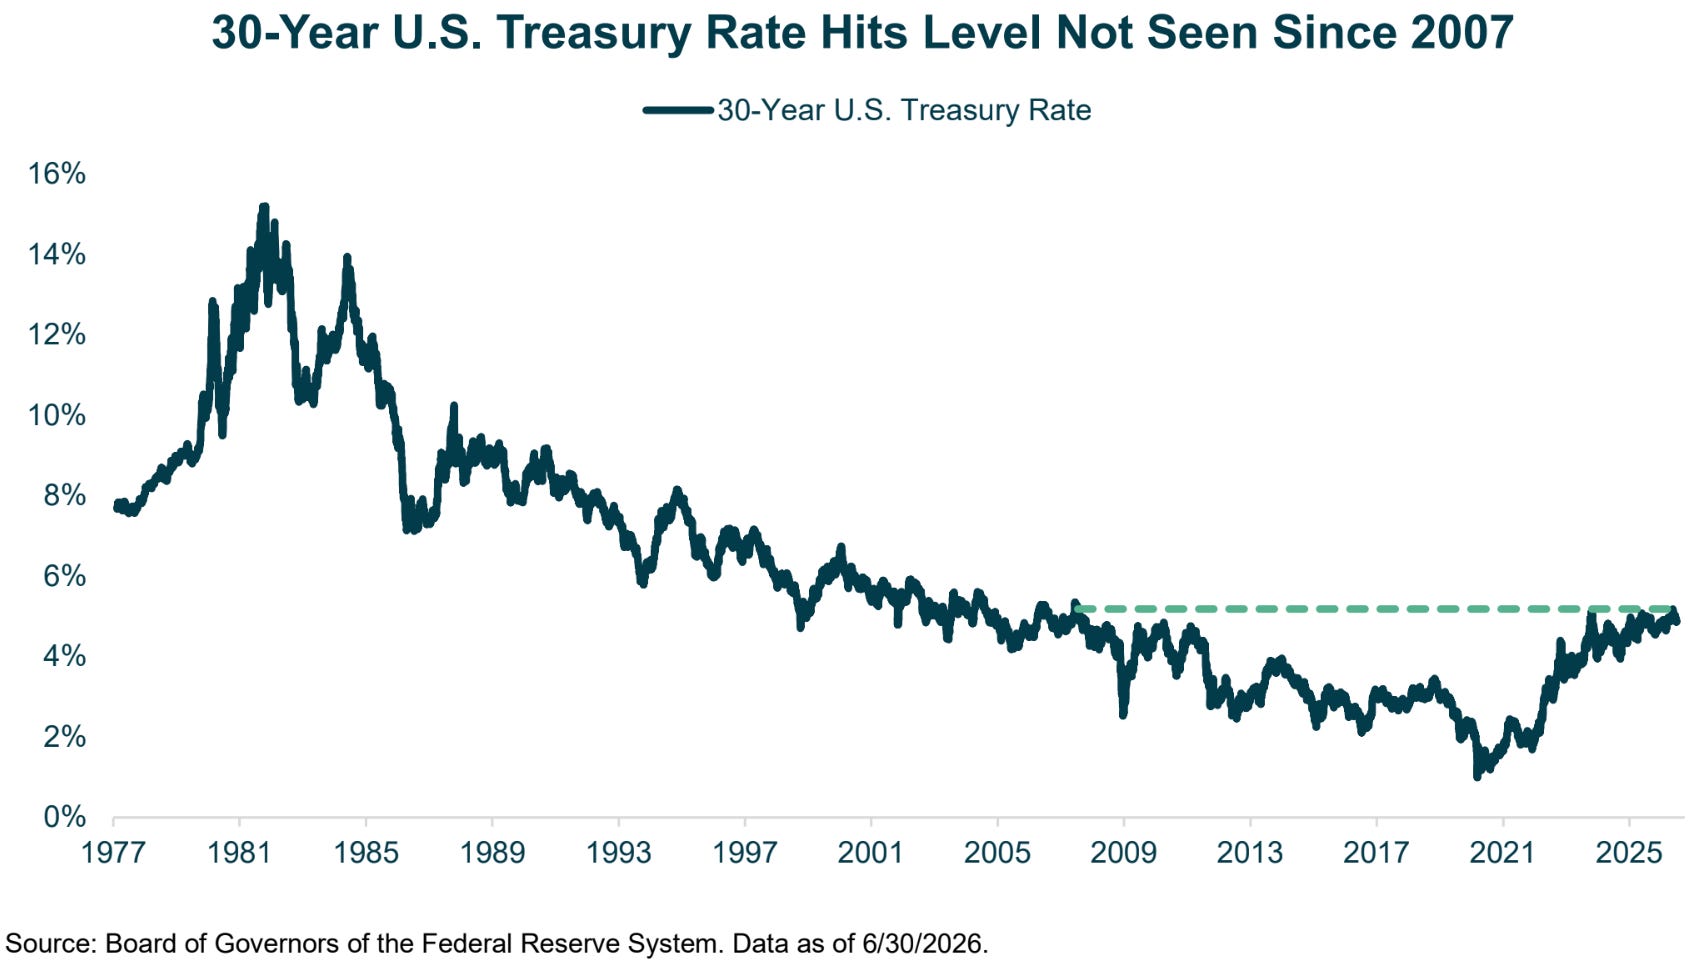
Fixed income mirrored the quarter’s round trip. The Federal Reserve maintained its policy rate at 3.50% to 3.75% in June, marking a fourth consecutive hold. In Treasuries, the two-year yield ended near 4.14% and the ten-year settled around 4.44%. The thirty-year spiked to a near two-decade high of 5.18% in mid-May before easing to 4.91% at June’s end. Overall, the Bloomberg U.S. Aggregate Bond Index returned a modest 0.67% for the quarter. Credit remained calm, with high yield bonds gaining 2.5% as spreads held near multi-year tights.
The War, the Oil Reversal, and Inflation’s Lag
The Middle East conflict was the dominant variable over the past two quarters. April began during its hot phase, with the Strait of Hormuz closed since late February and oil markets pricing in supply disruptions. Now, a signed “ceasefire” framework has partially reopened the strait, returning crude oil closer to pre-war levels.
A tentative “ceasefire” in early April led to a Pakistan-mediated framework and a mid-June memorandum of understanding signed by President Trump and Iranian President Masoud Pezeshkian. The agreement sought to end the conflict within sixty days and reopen the Strait of Hormuz for free commercial passage.

The market responded swiftly and one-directionally. Brent crude fell 26% in May from its late-April peak of $118/barrel to the mid-$80s, dropping further in June as the ceasefire framework took hold. By quarter-end, Brent traded near $73, its lowest since late February, returning to pre-war levels.
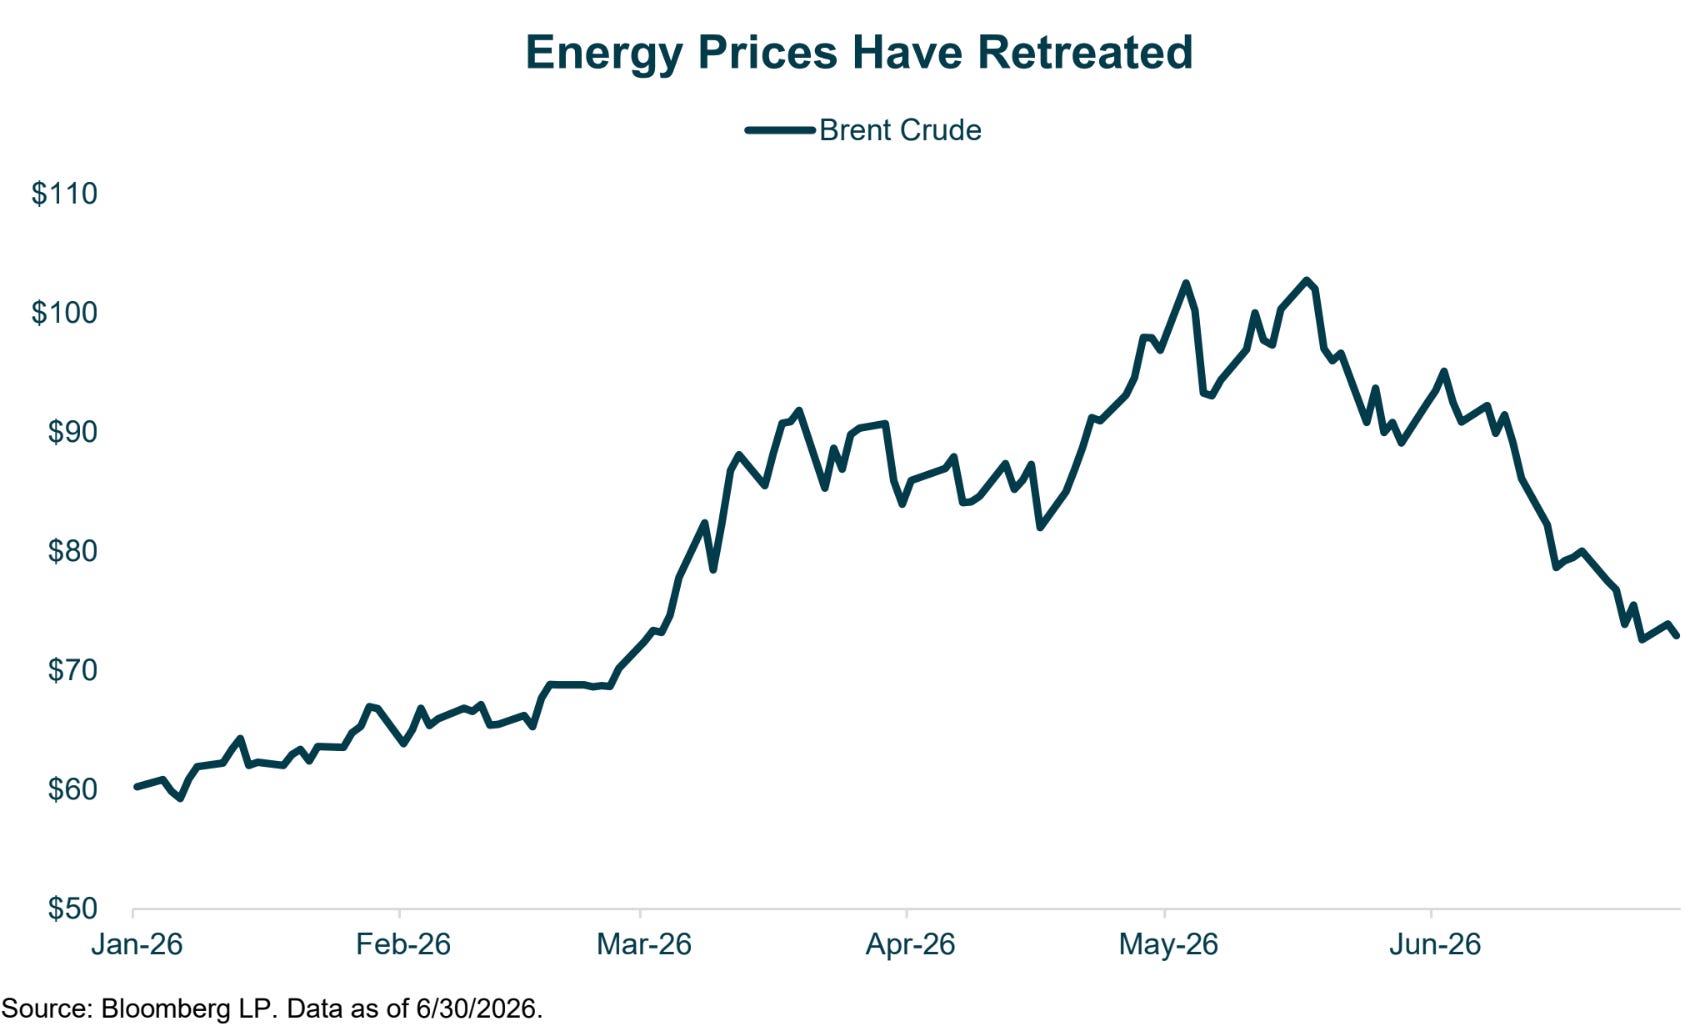
The Middle East conflict remains unsettled under a fragile, contested truce. In the quarter’s final days, Iran drone-struck a commercial vessel in the strait, prompting U.S. retaliatory strikes. While the oil market prices a return to normalcy, the physical market is far from it today.
This gap is a risk to watch closely, as the second-half disinflation narrative depends heavily on it.
Quarterly inflation data reflected the energy shock’s lag, hitting readings just as the conflict de-escalated. In May, headline PCE accelerated to 4.1% year-over-year (the highest since April 2023), the producer price index rose 6.5% (the steepest since late 2022), and core PCE reached 3.4% (the highest since October 2023). While declining oil prices may provide future relief, a sustained rise in core inflation remains a market concern.
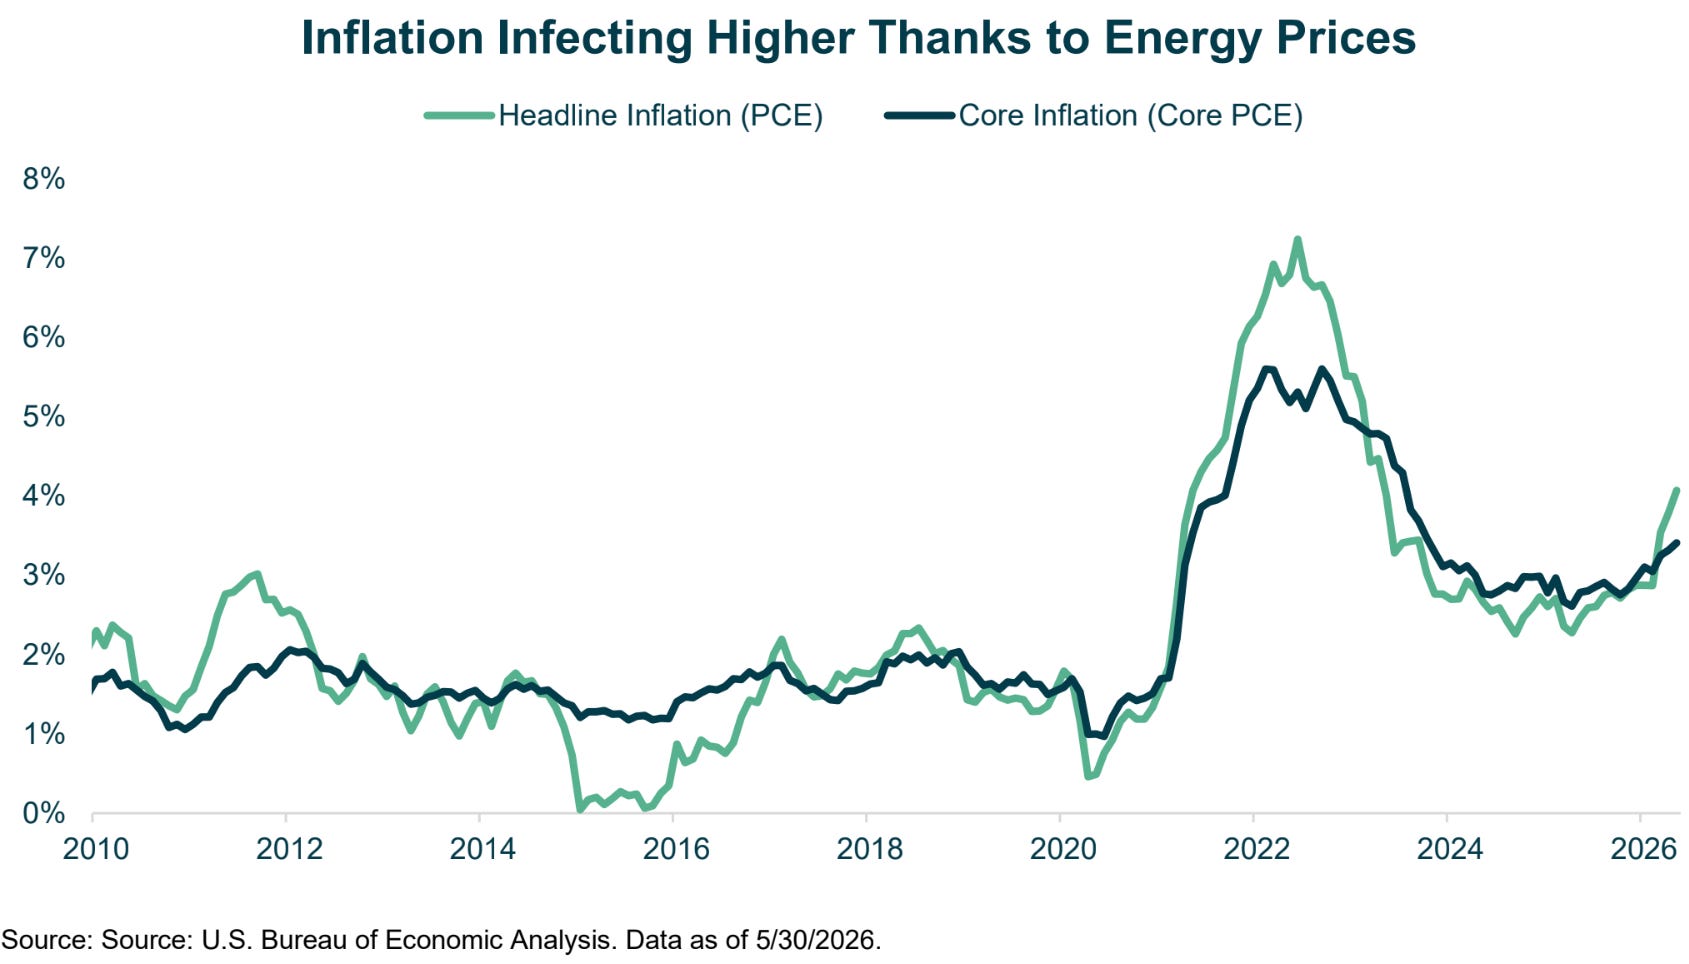
The 2026 inflation acceleration is primarily an energy-driven supply shock rather than a repeat of 2022’s demand-driven and new money creation inflation. Energy drove over 60% of the monthly consumer price increase, with its CPI component rising more than 23% year-over-year. Because supply shocks reverse as supply recovers, oil’s late-June return to pre-war levels suggests the inflation rate peak has passed. Supporting this, consumer sentiment recovered from May’s record low of 44.8 to 49.5 by late June, and long-run inflation rate expectations eased meaningfully.
A New Fed Under Warsh
New Fed Chair Kevin Warsh was confirmed by the Senate on May 13th by a narrow 54–45 vote.
Jerome Powell’s term ended two days later, but in a rare move for the past eighty years, he remained on the Board of Governors. This creates an unusual FOMC structure where a former chair retains a vote while his successor sets the agenda.
At Warsh’s first meeting as chair on June 16-17, the Committee unanimously held the federal funds rate steady at 3.50% to 3.75%, marking the fourth consecutive hold. However, nearly everything else changed: the post-meeting statement was slashed to about 130 words from 341 words at Powell’s last April meeting. Furthermore, it eliminated the long-standing forward guidance and easing bias, reinforcing a renewed commitment to price stability.
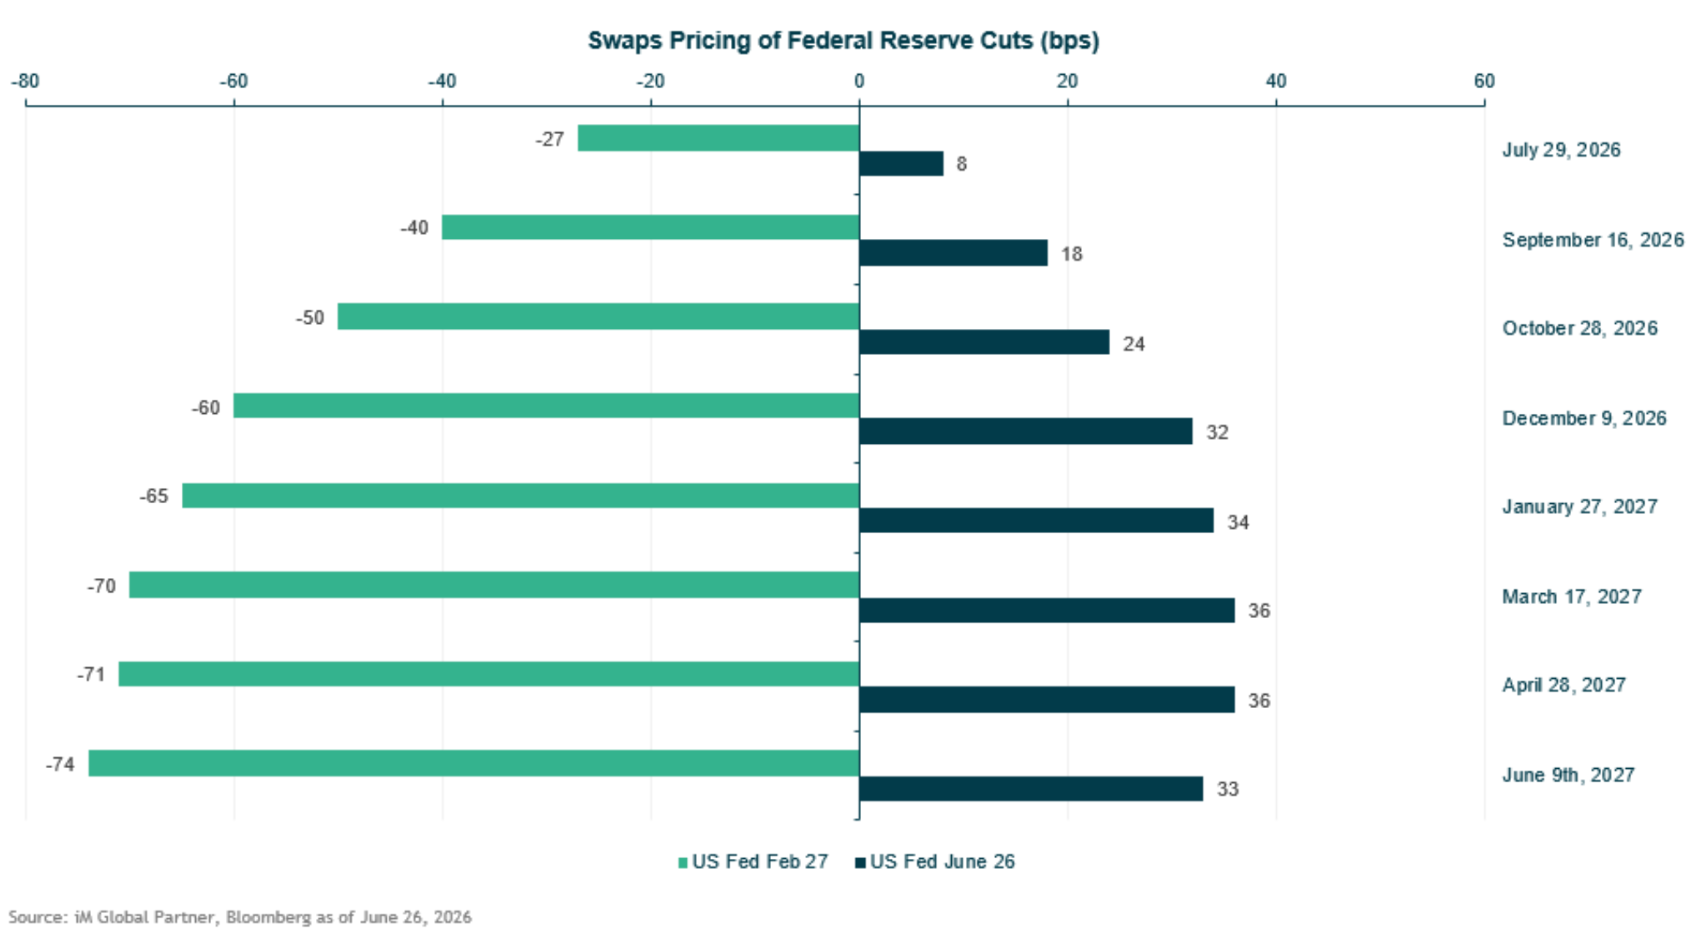
The Summary of Economic Projections revised both inflation and Federal funds rate expectations upward. The median 2026 rate projection rose to 3.8% from March’s 3.4%, implying a rate hike. Nine of eighteen participants projected at least one increase this year, and seventeen viewed inflation risks as tilted up. The Committee raised headline PCE inflation projections to 3.6% (up from 2.7%) and trimmed growth forecasts to 2.2% (down from 2.4%).
Notably, Chair Warsh abstained from submitting a projection, signaling doubt in the utility of the Fed’s rate projection framework. He announced five task forces on inflation, productivity under AI, data sources, communication, and balance sheet management, aiming for year-end policy recommendations.
Reversing its 2025 decline, the USD hit a post-Liberation Day high while gold sold off and the front end of the Treasury curve rose. By quarter-end, markets completely reversed their early-year easing narrative, pricing in likely rate hikes for October and December.
Amid Trump administration pressure for lower rates, a narrow confirmation vote underscored how contested this transition was.
By implying higher rates in the June projections, the chair demonstrated independence opposite to what was demanded. Whether this independence persists remains a critical, unanswered institutional question facing markets over the next several years.
Equity Markets
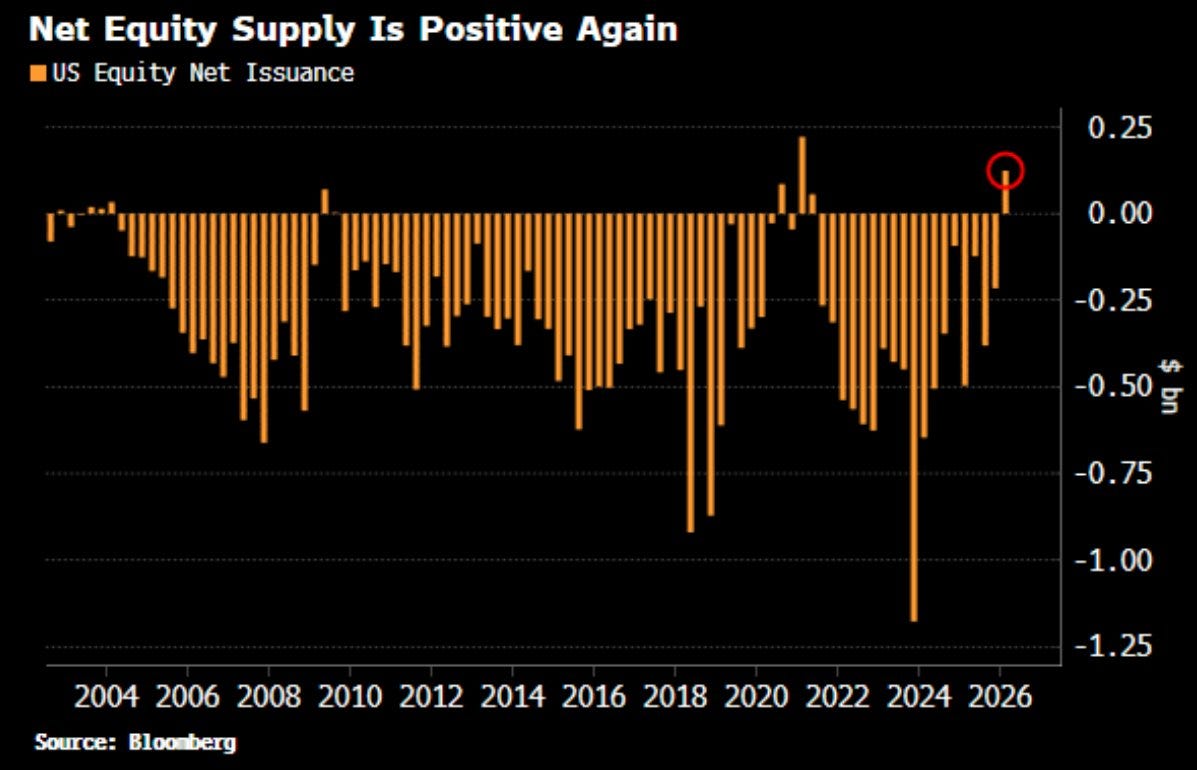
Artificial intelligence remained the primary driver of the second-quarter rally, as tech hyperscalers heavily increased capital expenditure guidance, bringing planned spending over the next 12 months to nearly $850 billion. As a prime beneficiary, NVIDIA reported record quarterly revenue of $81.6 billion in late May, up 85% year-over-year, with data center revenue nearly doubling. While these massive investments are generally supported by real profits and free cash flow rather than debt, a significant rise in equity and debt issuance (thus elimination of stock buybacks which was the norm for over 20 years) during the quarter signaled a shift toward external funding for CAPEX.
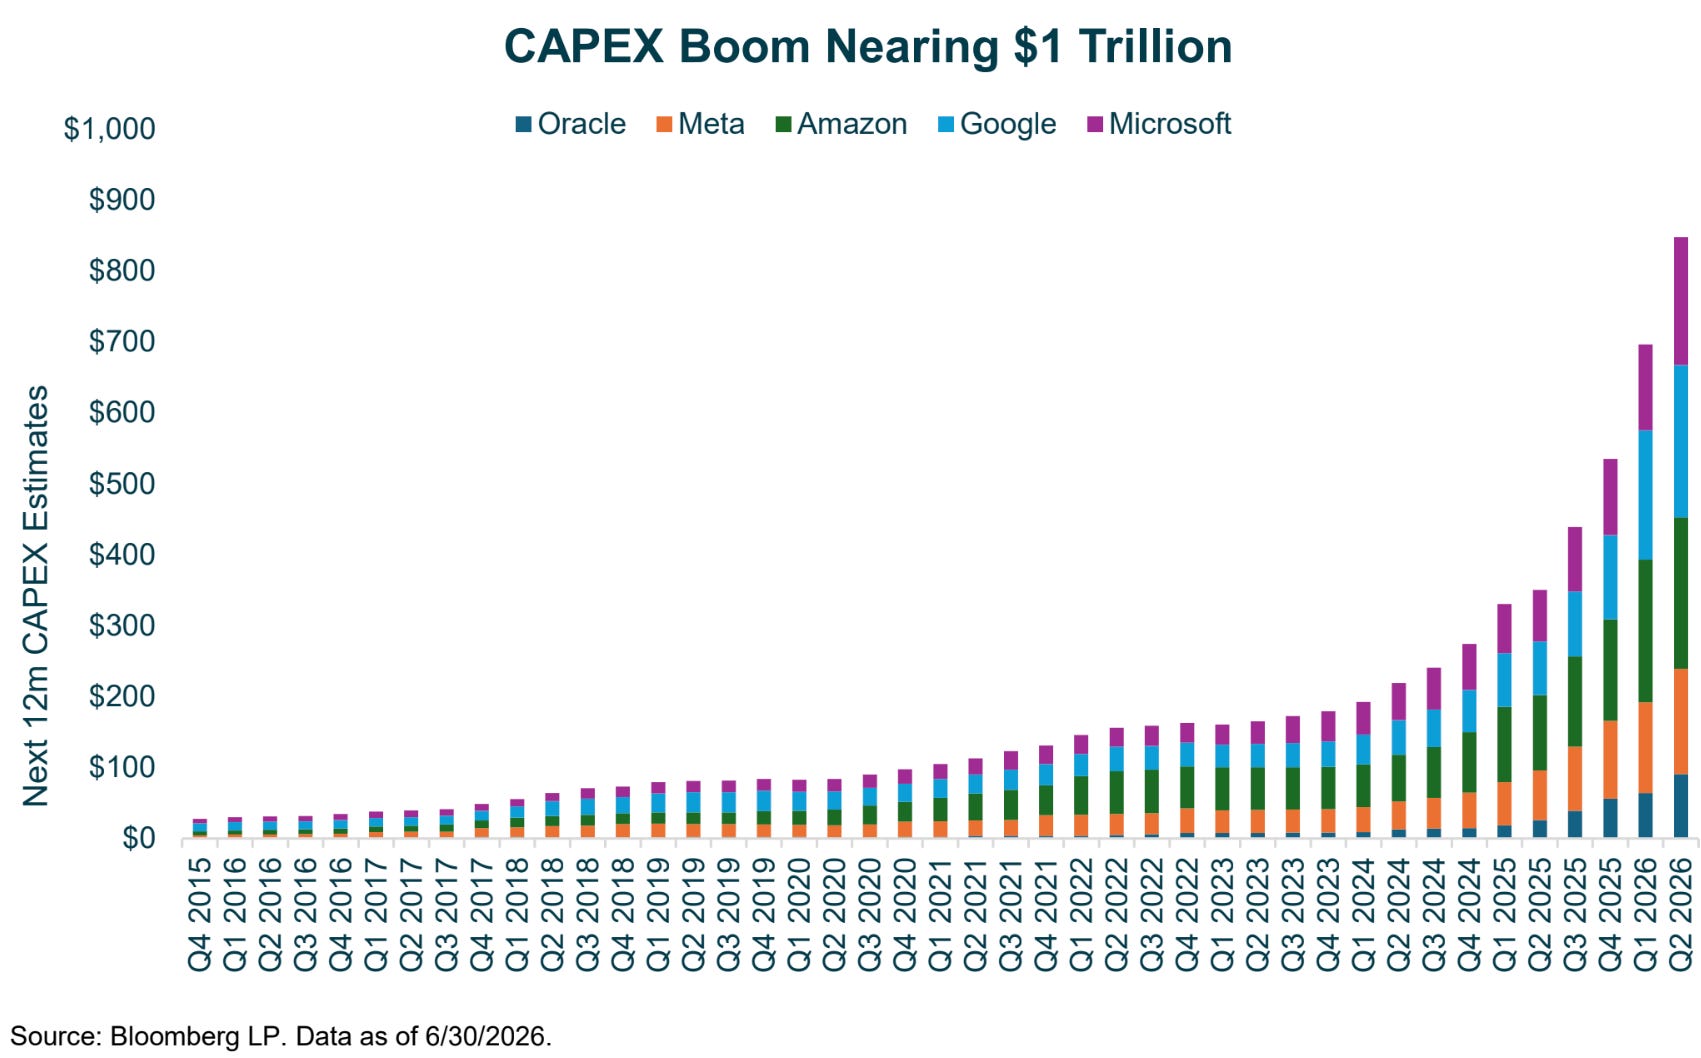
Despite massive CAPEX spending, the quarter highlighted the immense risk concentrated in a few names. The Magnificent Seven now comprise nearly one-third of the S&P 500, a historic level of concentration. The index’s forward price to earnings multiple sits near 21x, exceeding its five and ten year averages—a premium driven overwhelmingly by these few stocks. While valuations are not market-timing signals, they signify lower long-run expected returns from today’s starting point.
U.S. equity markets stumbled twice in June during severe tech selloffs. On June 5, a disappointing capital-spending signal from Broadcom triggered a violent semiconductor rout, erasing over a trillion dollars in market value in a single session as the Philadelphia semiconductor index fell over 8% and the Nasdaq dropped 4.2%—its worst day in over a year. A second selloff occurred in the final week around Micron’s earnings, dragging chip names and mega-cap platforms lower as speculative capital retreated.
Although underlying computing demand remained strong, these episodes demonstrated that the extraordinarily high bar for outperformance leaves the market vulnerable to massive, rapid losses from even modest guidance disappointments.
Despite AI trade volatility, the broader market remained resilient as the equal-weighted index, small caps, and neglected sectors gained traction in late June. While not a guaranteed permanent leadership shift, this late-quarter rotation is a welcome development.
Q2 returns outside the U.S. were solid, led by emerging markets (+24.1%), especially South Korea. Driven by global demand for AI high-bandwidth memory chips from Samsung and SK Hynix, Korean equities surged over 38% in April (its best since 1998) and 35% in May, leaving MSCI Korea up 118.6% in 2026’s first half.
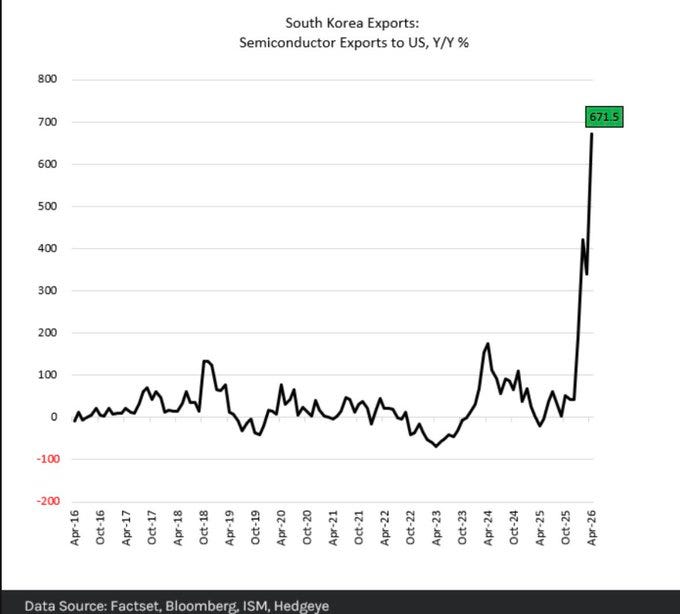
Japan hit record highs on similar semiconductor tailwinds, and developed Europe posted solid gains, proving the AI theme extends far beyond the U.S. into markets like South Korea, Taiwan, and Japan.
Bonds
In Q2, the bond market signaled more caution than equities. The 30-year Treasury yield hit a 19-year high of 5.18% in mid-May before easing below 5% by June end. Front-end yields rose slightly, pricing in a rate hike instead of cuts. By the end of June, the 10-year Treasury yield was 4.44%, the two-year near 4.14%, and the thirty-year near 4.91%, leaving the curve modestly upward-sloping after being inverted from 2022 to 2024. Notably, the spread between the two-year and 10-year halved from an early February high of 74 basis points to 30 basis points at quarter end.
By contrast, credit markets remained calm, showing no signs of stress despite two equity drawdowns and a hawkish Fed. High-yield and corporate bond spreads ended the quarter near multi-year tights at 275 and 75 basis points, respectively.
This tight pricing creates an unattractive asymmetry, leaving little room for further compression and poorly compensating investors for credit risk.
Investment Implications and Outlook
At the midpoint of 2026, the markets remain resilient, with asset prices near record highs after recovering Q1 losses.
This recovery occurred despite a three-year inflation rate high, the Federal Reserve shifting from cuts to projecting hikes, and one of the largest energy shocks in history. The market has chosen to look past it all.
Our constructive yet disciplined base case assumes relatively contained energy markets, allowing inflation to recede, consumer confidence to recover, and strong nominal earnings growth to persist. In this environment, the most attractive opportunities lie not in extended names, but in the market broadening observed late in the second quarter.
Consequently, our portfolios maintain robust diversification across asset classes (equities, bonds, commodities, and currencies) and positions (long and short).
Going long means making money when prices rise.
This is buying low then selling high.
Going short means making money when prices fall.
This is selling high then buying low.
This is not a call against technology or artificial intelligence—both of which remain structurally central—but a recognition of unbalanced risk-reward in crowded market segments. In fixed income, the Fed’s hawkish stance and long-end pressures favor remaining underweight duration.
The path ahead centers on three markers.
First, if core PCE stays above 3% or the Fed hikes rates, short-duration assets should benefit while long-duration growth equities suffer.
Second, a Middle East ceasefire breakdown driving Brent crude above $100 would reintroduce stagflation risk, threatening the disinflation thesis dependent on an open Strait of Hormuz.
Third, hyperscaler CAPEX revisions and leading chip/memory guidance will indicate whether the AI investment cycle is accelerating or maturing.
Despite unresolved risks, Q2 propelled markets to record highs, reminding us that they often confound investors.
This highlights the need to stay invested—supported by economic and earnings growth—and diversified, as concentration at the top remains a vulnerability while the broadening beneath offers opportunity.
Thank you for your continued trust and partnership.

Disclaimer
This website is not an offer or solicitation in any jurisdiction in which the firm is not registered. Information presented is for educational purposes only. It should not be considered specific investment advice, does not take into consideration your specific situation, and does not intend to make an offer or solicitation for the sale or purchase of any securities or investment strategies. The services, securities and financial instruments described on this website may not be suitable for you, and not all strategies are appropriate at all times. Investments involve risk and are not guaranteed. Past performance is not necessarily a guide to future performance. Independent advice should be sought in all cases.
TYME Advisors is a U.S. Securities and Exchange Commission (SEC) Registered Investment Advisor . Registration does not imply a certain level of skill or training. Information about the firm including the Customer Relationship Summary is available on the SEC’s website at www.adviserinfo.sec.gov. Information about our privacy policy is located here.