Q4 2025 Portfolio Commentary
A Long/Short Longboat Update

This commentary is based upon client quarterly portfolio reports.
It is intended as supplementary material to those reports.
Investing is a means to an end and is step 3 in our financial planning process.

That end is accomplishing your financial goals per your custom financial plan.
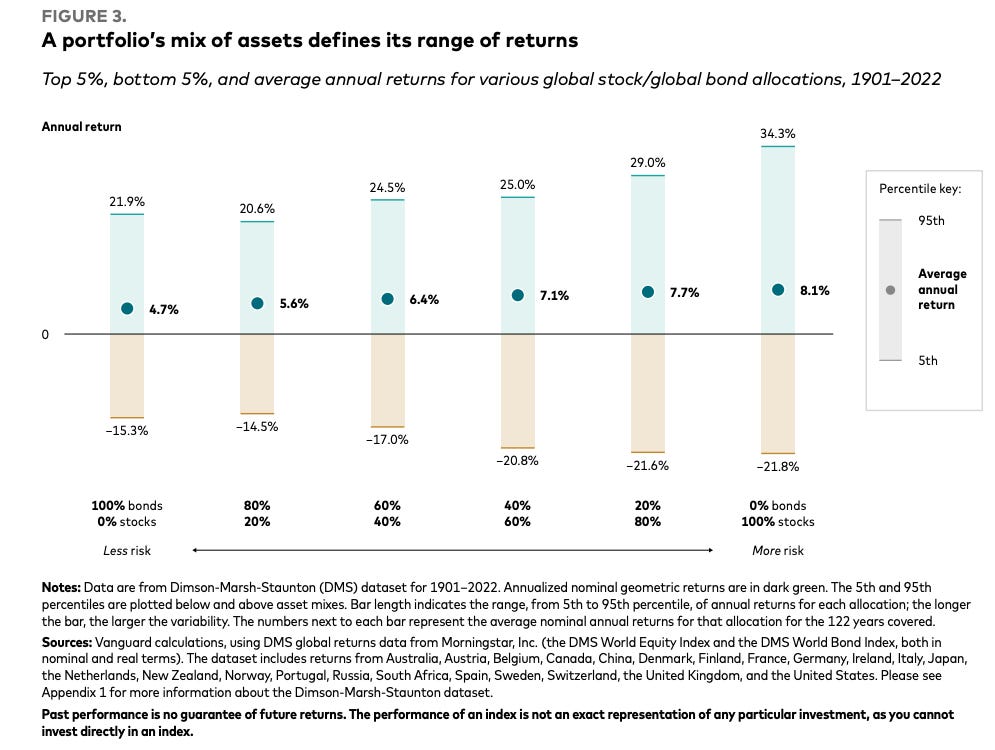
Every financial plan has an implied required return (RR) that must be earned over the long term for the portfolio to do its part in making a financial plan robust.
Furthermore, the following is a good expectations cleanser.
It shows the top 5%, bottom 5%, and the average annual return for various global stock/global bond allocations looking back 120+ years (1901–2022).
It illustrates the historical range of possibility (extreme good annual return, extreme bad annual return, and average annual return) by different portfolio types from the least risky allocation (100% bonds on the left) to the most risky (100% stocks on the right).
With that said, let us compare how the managed portfolios have performed relative to their respective RR and to their respective comparable low cost publicly traded diversified portfolio benchmarks.

Aggressive Portfolios
Relative to the Required Return (RR)
For the Quarter
They underperformed their RR benchmarks.
For the Year
They materially outperformed their RR benchmarks.
Relative to Comparable Portfolio Benchmarks
For the Quarter
They underperformed their RR benchmarks.
For the Year
They materially outperformed their RR benchmarks.
Balanced Portfolios
Relative to the Required Return (RR)
For the Quarter
They underperformed their RR benchmarks.
For the Year
They materially outperformed their RR benchmarks.
Relative to Comparable Portfolio Benchmarks
For the Quarter
They underperformed their RR benchmarks.
For the Year
They materially outperformed their moderate portfolio benchmarks.
Cash Reserve Portfolios
Relative to Comparable Portfolio Benchmarks
For the Quarter
They performed in line with their cash reserve portfolio benchmarks.
For the Year
They performed in line with their cash reserve portfolio benchmarks.
The Equity Sleeve
The Performance
For the Quarter
It underperformed the world equity benchmark.
For the Year
It was in line with the world equity benchmark.
The Attribution
For the Quarter
Key Contributors (added value during the period)
High Quality US Large Companies
Japan (Dynamically Hedged)
Precious Metal Royalty/Streaming Companies
Key Detractors (subtracted value during the period)
Bitcoin
Global Armaments
For the Year
Key Contributors (added value during the period)
Global Armaments
High Quality US Large Companies
Precious Metal Royalty/Streaming Companies
Key Detractors (subtracted value during the period)
Bitcoin
West Texas Real Estate
The Systematic Long/Short Extensions
This position only applies to those with large taxable account balances.
This takes tax loss harvesting 1.0 and upgrades it to tax loss harvesting 2.0.
It improves after-tax wealth compounding within a risk-managed framework and has several practical uses, including diversifying concentrated stocks, revitalizing "frozen" taxable accounts with large unrealized capital gains, and building up tax losses to offset future gains.
For a deeper dive, checkout the post below:

They were in line with its benchmarks and also reduced concentrated positions with significant embedded gains and yet only realized net short term losses.
Going long means making money when prices rise. This is buying low then selling high.
Going short means making money when prices fall. This is selling high then buying low.
These net short term realized losses were primarily from closing out short positions which makes sense given stocks went up for the quarter.
Exited Positions
Bitcoin
Despite our long term bullish views on this asset, we still incorporate a risk management framework akin to how commodity trading funds (CTAs) risk manage their long and short positions across equities, currencies, bonds, and commodities. We began reducing the exposure in October and completely exited in mid November. We are pleased with this process as this position kept falling after we exited while the US Large Cap equities we rotated into continued to increase in value.
It is very likely we will add back exposure once our same risk management framework indicates favorable conditions are in place.
For our long term views on this asset, checkout this post.

Japan (Unhedged)
Despite our long term bullish views on this asset, we exited this position as the currency headwinds from a weakening Yen relative to USD continued to increase in strength despite the material progress the underlying Japanese companies continued to produce.
We ultimately rotated into a different type of Japanese exposure which is discussed in the new positions section.
For our long term views on this asset, checkout this post.

West Texas Real Estate
Despite our long term bullish views on this asset, we exited one of our positions in this space as the incoming bottom up quantitative signals from Mr. Market began to indicate unfavorable weather patterns for this exposure.
Maintained Positions
High Quality US Large Companies
The Summary
This exposure consists of US Large Companies and then seeks to earn superior long term returns with lower downside risk by filtering out junk companies (overvalued and low quality companies run by poor management teams).
It filters out these factors which are a concentrated source of downside risk:
High External Financing: companies that are over reliant on external capital through high debt or stock sales (i.e. a farmer who keeps selling his land to buy seeds for planting crops).
Wealth Destroyers: companies that reinvest cash flow but generate economic returns below their cost of capital (i.e. borrow at 8% to earn 2% which destroys 6%).
Value Traps: companies where intrinsic value is lower than book value (i.e. a home that seems cheap on a price per square foot basis but it has a cracked foundation, rotted support beams, etc).
The Performance
For the Quarter
This position outperformed the world equity benchmark.
For the Year
This position was in line with the world equity benchmark.
Key Contributors
For the Quarter
The primary contributors to this outperformance were our exposures to
For the Year
The primary contributors to its performance were our exposures to
Global Armaments
The Summary
This exposure focuses on companies that make armaments for nation state security.
For our deep dive into this topic, checkout this post:
Global Armaments

Let us examine the question of armament spending thru our applied history framework, which we see as a practical tool that uses the laboratory of the past to better understand and navigate the complexities of the present and future.
To summarize our extensive research on this topic which we have previously written about: the entire world is rapidly rearming off an extremely low base of defense spending.
The Performance
For the Quarter
This position underperformed the world equity benchmark.
Key Contributors
The top three contributors to this underperformance came from
Rheinmetall (German Defense)
BAE Systems (British Defense)
AeroVironment (US Defense)
For the Year
This position materially outperformed the world equity benchmark.
Key Contributors
The top three contributors to this outperformance came from
Rheinmetall (German Defense)
Palantir Technologies (US Defense)
RTX (US Defense)
Precious Metal Royalty/Streaming Companies
The Summary
This provides us with a diversified exposure to precious metals (gold and silver) by benefiting from both price appreciation of the metals and the production growth of the mines without the operational risks of mining.
Additionally, these exposures typically do well when traditional exposures do not and thus provides potent equity portfolio diversification.
Exposure 1
Royalty and Streaming Financier: It provides upfront capital to mining companies in exchange for either a royalty (a percentage of the mine’s future revenue) or a stream (the right to buy future metal production at a fixed, low price). It is a financier, not a mine operator.
Holds a Vast, Diversified Portfolio: Its assets include hundreds of royalties and streams, primarily in gold, but also silver, platinum group metals, and other commodities. This diversification across different assets, geographies, and operators significantly reduces single-project risk.
Maintains Exposure to Oil & Gas Royalties: Uniquely among its peers, it also holds a significant portfolio of oil and gas royalties. This provides an additional layer of commodity diversification and a hedge against different economic cycles.
Gains “Free” Optionality on Exploration: A core part of its model is acquiring royalties on vast land packages. If the mining partner discovers more resources on that land, its royalty interest applies to the new discoveries without it having to invest another dollar in exploration or development costs.
Exposure 2
Pioneered the Precious Metals “Streaming” Model: It specializes in streaming agreements. They make a large, upfront payment to a mining company and in return receive the right to buy a percentage of that mine’s future gold or silver production at a deeply discounted, fixed price (e.g., ~$400/ounce for gold).
Targets By-Product Metals from Base Metal Mines: A key strategy is to provide capital to miners of base metals like copper or zinc. These miners often treat the gold and silver produced alongside their primary metal as a secondary “by-product.” It unlocks the value of these precious metals for the miner, securing the stream for themselves.
Secures Contracts on Large, Long-Life Assets: It focuses on partnering with major mining companies on large-scale, low-cost mining operations. This ensures their streams are tied to assets that will be producing metal for decades, providing highly predictable, long-term cash flow.
Creates Massive Margin Expansion: Because its purchase price is fixed by contract, its profit margin expands dramatically as the spot price of gold and silver rises. Unlike a miner, its costs do not inflate with the price of the commodity, a key feature for an inflation hedge.
Offers a “Pure-Play” Streaming Investment: It focuses exclusively on precious metals streaming, primarily gold and silver. This provides us with direct, high-leverage exposure to precious metals prices without the complexities of other commodities or royalty types.
What they have in common:
Buy Low ; Sell High: Royalty/Streaming companies provide upfront capital to mining companies in exchange for the right to receive a portion of future production (typically gold, silver, or other precious metals) at a fixed, discounted price or as a percentage of output.
Avoids Cost Overruns: Unlike traditional miners, royalty/streaming companies do not operate mines themselves; they earn revenue streams based on the exploration and production activities of third-party operators/miners.
Capital Light Businesses: These companies are considered "capital-light" because they avoid the significant capital expenditures, operating costs, and post-production liabilities associated with direct mining operations.
Positive Asymmetric Optionality: This structure offers "asymmetric optionality": revenues can increase both from higher metals prices and from increased production at the underlying mines, while the company itself bears minimal ongoing costs.
Inflation Protection: Precious metals generally perform well in inflationary environments, and these companies provide magnified exposure to these price movements, making them potentially inflation beneficiaries.
All-Weather Resilience: They can perform well in various economic regimes (high/low growth, high/low inflation), not just during inflationary periods.
Long-Duration Assets: Many agreements are tied to long-life mines, sometimes with decades or even centuries of production potential, providing enduring revenue streams.
Optionality and Scarcity Value: As new mine discoveries become rarer and existing high-quality assets more valuable, holding royalties/streams on these assets becomes increasingly advantageous.
Mine Diversification: Royalty/Streaming companies often hold interests in multiple mines and jurisdictions, reducing concentration risk and increasing the stability of cash flows.
The Performance
For the Quarter
Exposure 1 underperformed the world equity benchmark and Exposure 2 outperformed.
Key Contributors
The outperformance came from:
The underperformance came from:
For the Year
These exposures materially outperformed the world equity benchmark.
Key Contributors
The top contributors to this outperformance came from
West Texas Real Estate
The Summary
This is West Texas Real Estate along with the associated oil, gas, and water rights.
Vast, Perpetual Land Holdings: It is one of the largest private landowners in Texas, with approximately 870,000 acres of surface estate and 2.4 million acres of mineral interests, primarily in the Permian Basin. Additionally, this exposure is located in District 8 which is responsible for about 20% of all oil and gas production in the U.S. This land is a finite, irreplaceable asset that cannot be replicated.
High-Margin Royalty Income: It owns perpetual oil and gas royalty interests on hundreds of thousands of acres. This generates high-margin revenue from energy production without the associated capital expenditures or operating risks of exploration and production companies.
Capital-Light Compounding Machine: The business model requires minimal capital investment to generate revenue, leading to extremely high free cash flow. This cash can be used for dividends, share buybacks, and acquiring more royalty assets, creating a powerful compounding effect over time.
Zero Debt: It has a pristine balance sheet with no debt, making it incredibly resilient through all economic cycles.
Multi-Faceted Revenue Streams: Beyond oil and gas, it generates revenue from surface leases, easements for pipelines, water sales, and other commercial activities, providing diverse and growing income streams.
Hard Asset Focus: This is a pure-play land and resource company. Its value is tied directly to tangible, finite assets rather than intellectual property or manufacturing processes.
Inflation Beneficiaries: Its revenues from royalties and leases are intrinsically linked to commodity prices and economic activity, making them excellent hedges against monetary inflation.
Capital-Light Business Model: It primarily leases its assets to others and collects high-margin fees and royalties, avoiding the heavy capital costs and operational risks of its tenants (e.g., oil drillers, data center operators, bitcoin miners, etc).
Permian Basin Location: Its strategically centered in the Permian Basin, the most prolific and economically viable oil and gas producing region in North America.
The Performance
For the Quarter
It underperformed the world equity benchmark.
Key Contributors
The underperformance came from:
For the Year
It underperformed the world equity benchmark.
Key Contributors
The underperformance came from:
Capital Markets Exchanges
The Summary
These are essential, high-margin “toll roads” for the economy. They have immense operating leverage, meaning once their infrastructure is in place, revenue from increased trading volume flows directly to profits with minimal extra cost. Furthermore, their revenue is naturally hedged against inflation, as it’s tied to the nominal value of transactions, and they benefit from strong network effects and high regulatory barriers that create a durable competitive advantage.
Exposure 1
Market Technology/SaaS Provider: It licenses and sells its critical trading, clearing, and surveillance technology to over 130 other exchanges, regulators, and financial institutions worldwide. This is a high-margin, software-as-a-service (SaaS) business.
Listing Services: It operates a critical US stock market, where companies pay initial and recurring fees to list their shares for public trading. This creates a durable, long-term revenue stream.
Data & Indexing: The company collects vast amounts of proprietary market data (like quotes and trades) and sells it to a wide range of customers. It also creates and licenses its influential indexes to providers of exchange-traded funds (ETFs) and other financial products for a fee based on the assets under management (AUM).
Trading & Clearing: It earns transaction fees from the buying and selling of securities (stocks, options) on its exchanges and provides clearing services to ensure those trades are settled.
Exposure 2
Proprietary, High-Demand Products: Unlike other exchanges that just trade other companies' stocks, it owns unique, indispensable products that it created. Key examples include:
The VIX: This index is the globally recognized standard for equity market volatility. It has a monopoly on VIX options and futures, which are essential for hedging.
SPX Options: It has exclusive rights to options on the S&P 500 index, the most important benchmark for the U.S. stock market.
Leader in Secular Growth Trends: It is at the center of the explosive growth in index options and derivatives used for sophisticated hedging and income-generating strategies, including the recent rise of Zero-Days-to-Expiration (0DTE) options.
Pricing Power: Because it owns these exclusive, must-have products, it has significant power to set the fees for trading them, protecting its high margins.
What they have in common:
Consistent Trading Fee Generation: Exchanges, as toll booth operators, are the only consistent beneficiaries of trading activity over time. While most market participants are engaged in a zero-sum game, exchanges reliably earn fees from every transaction, regardless of market direction or participant success.
Recurring Revenue from Data Sales: Exchanges own and sell vast amounts of proprietary market data to traders, hedge funds, and media outlets. This is a high-margin, recurring, and growing revenue stream.
Asset-Light, High-Margin Business Model: Like royalty/streaming companies, exchanges operate with minimal capital requirements and have high cash operating profit margins. They are largely insulated from balance sheet vulnerabilities since they do not require significant borrowing or capital investment.
Breadth of Economic Exposure: Unlike royalty/streaming companies, which are typically tied to a single commodity or sector, exchanges benefit from a broad array of economic activities. They participate in every market large enough to require centralized, regulated trading—including equities, bonds, commodities, derivatives, and increasingly, digital assets.
Resilience and Adaptability: Many exchanges are among the oldest continuously operating businesses, having adapted to technological and regulatory changes over centuries (for example the London Stock Exchange has its roots in Jonathan’s Coffee-House circa 1698). Their business model remains robust and relevant, even as new asset classes (such as digital assets) emerge.
Beneficiaries of Volatility and Innovation: Exchanges often see increased earnings during periods of market volatility and uncertainty, as trading volumes and spreads rise. They also stand to benefit from innovations like blockchain and digital assets, which can significantly expand the universe of tradable instruments.
Limited Competition and Regulatory Moats: There are typically only a handful of regulated exchanges in each country, often due to regulatory preference for fewer, more easily supervised entities. This limited competition supports pricing power and high profitability.
The Performance
For the Quarter
Exposure 1 outperformed the world equity benchmark and Exposure 2 was in line with the world equity benchmark .
Key Contributors
The outperformance came from:
The in line performance came from:
For the Year
These exposures materially outperformed the world equity benchmark.
Key Contributors
The top contributors to this outperformance came from
New Positions
Japan (Dynamic Currency Hedging)
This exposure starts with a universe of 1,300+ Japanese companies and filters out companies that treat shareholders poorly based upon shareholder yield and corporate governance screens.
The final portfolio is less than 200 companies that statistically treat shareholders better than the starting index.
The next step is to determine the level of currency hedging.
From the perspective of a US investor, when one buys a Japanese stock you are impacted by both the local performance of the Japanese company in its own currency (Yen) i.e. just the stock performance as well as the performance of USD relative to the Japanese Yen.
Given that we don’t want the currency performance of USD relative to Yen to pollute the expression of the position, this exposure dynamically hedges this foreign currency (FX) risk.
This position dynamically updates its currency hedge (0% hedge means full exposure to Yen and 100% hedge means 0% exposure to Yen) based on a four separate currency models to determine what the hedge ratio should be.
At year end, the hedge ratio was at 75% which means the foreign currency performance exposure is only 25%.
The Alternative Sleeve
The Performance
For the Quarter
This position materially outperformed the world equity benchmark and the world bond benchmark.
As a reminder, the alternatives we consider are designed to generate returns that are low to negatively correlated to both equities and bonds (they zig when equities/bonds zag).
The Attribution
The top contributors to this outperformance came from:
Gresham’s Wrath (Gold Bullion with a Twist)
Gold Bullion (Fully Allocated Physical Gold Bullion held at the Royal Canadian Mint)
For the Year
This position materially outperformed the world equity benchmark and the world bond benchmark.
The Attribution
The top contributors to this outperformance came from:
Gresham’s Wrath (Gold Bullion with a Twist)
Gold Bullion (Fully Allocated Physical Gold Bullion held at the Royal Canadian Mint)
New Positions
None
Exited Positions
None
Maintained Positions
Managed Futures
The Summary
An exposure designed to generate absolute returns, low correlations to equities (they zig when equities/bonds zag), and help manage downside risk during risk-off events.
Going long means making money when prices rise. This is buying low then selling high.
Going short means making money when prices fall. This is selling high then buying low.
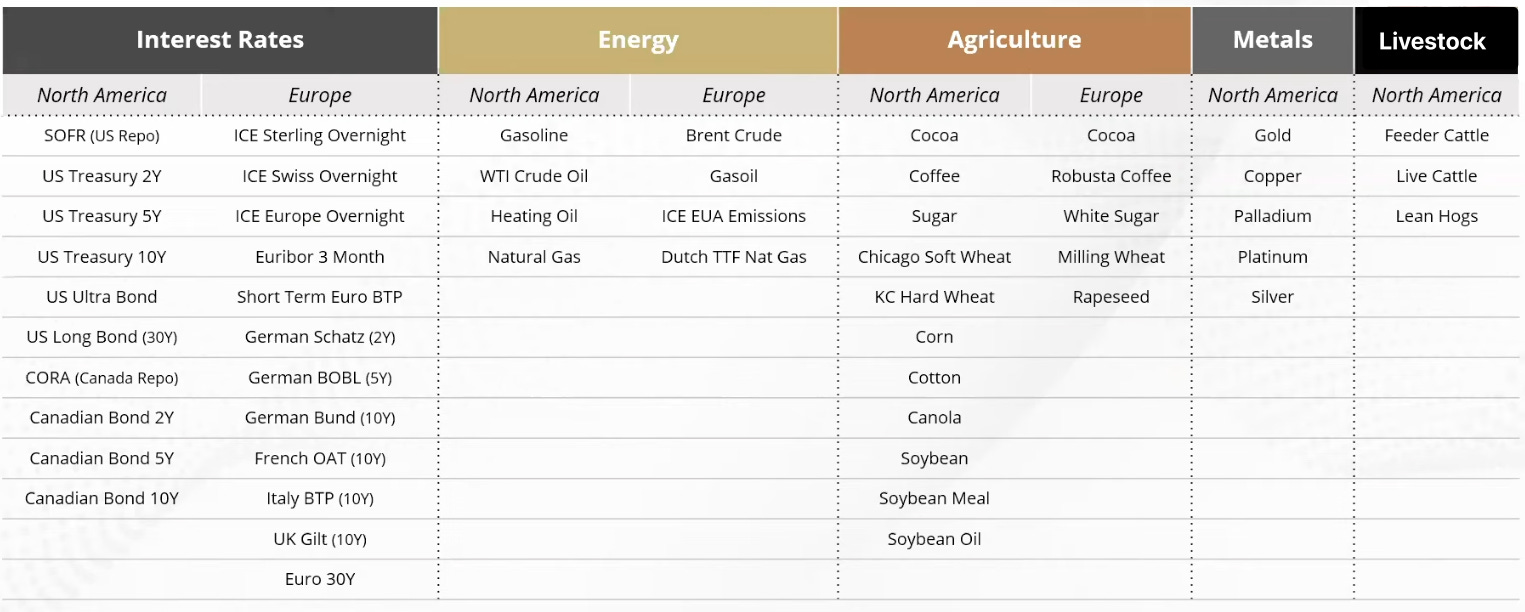
During Q4 2025, this exposure got updated to include European Interest Rates, European Energy, and European Agriculture.
Previously, the exposures were North American Interest Rates, North American Energy, North American Agriculture, North American Metals, and North American Livestock.
With a larger opportunity set across North America and Europe we think the merits of the strategy have been materially improved.
Below represents the different exposures that we can go long or short by asset class, region, and instrument.
As a reminder, this position uses multiple models which are each designed to capture different market dynamics.
Price Trend: aims to perform during periods of disruption, high volatility, and outsized moves in price.
Fundamental Reversion: detects when markets have moved too far from fair value, seeking to deliver returns during periods of lower/falling volatility.
Carry: looks to perform during periods of flat or falling interest rates.
Risk-Off: seeks to capture upward/downward.
With regards to recent history, this type of strategy materially protected our capital in 2022 when virtually every long only vanilla stock and bond investor got crushed.
With regards to deep history, there is asymmetric value in these strategies at an ultra low starting point of armament spending which leads to
Failed deterrence and then
A resurgence in armament spending which disrupts bond markets and then
Kinetic conflict which disrupts commodity markets
This is a pattern we identified in our aforementioned deep dive into global armaments.
Moreover, the beauty of this investment style is the ruthless execution of its quantitive rules which means there is no psychological barriers to changing one’s mind and thus positions when the data says the world is changing.
In fact, the long term evidence of this strategy’s veracity is the human tendency to under-react to long term real world fundamental change (we tend to assume the recent past will continue into the future).
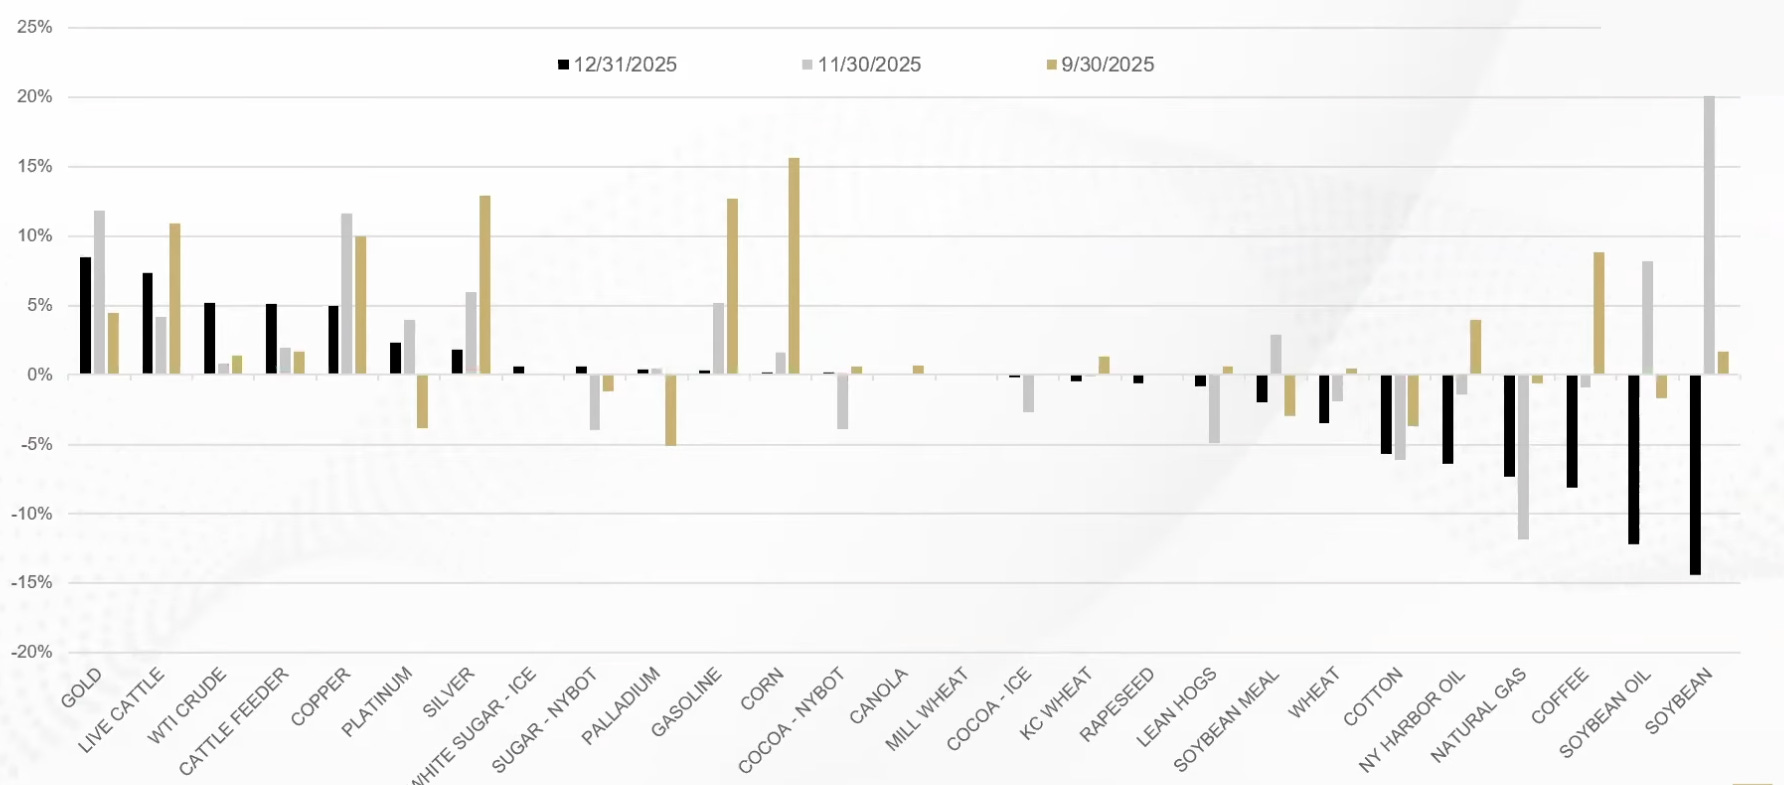
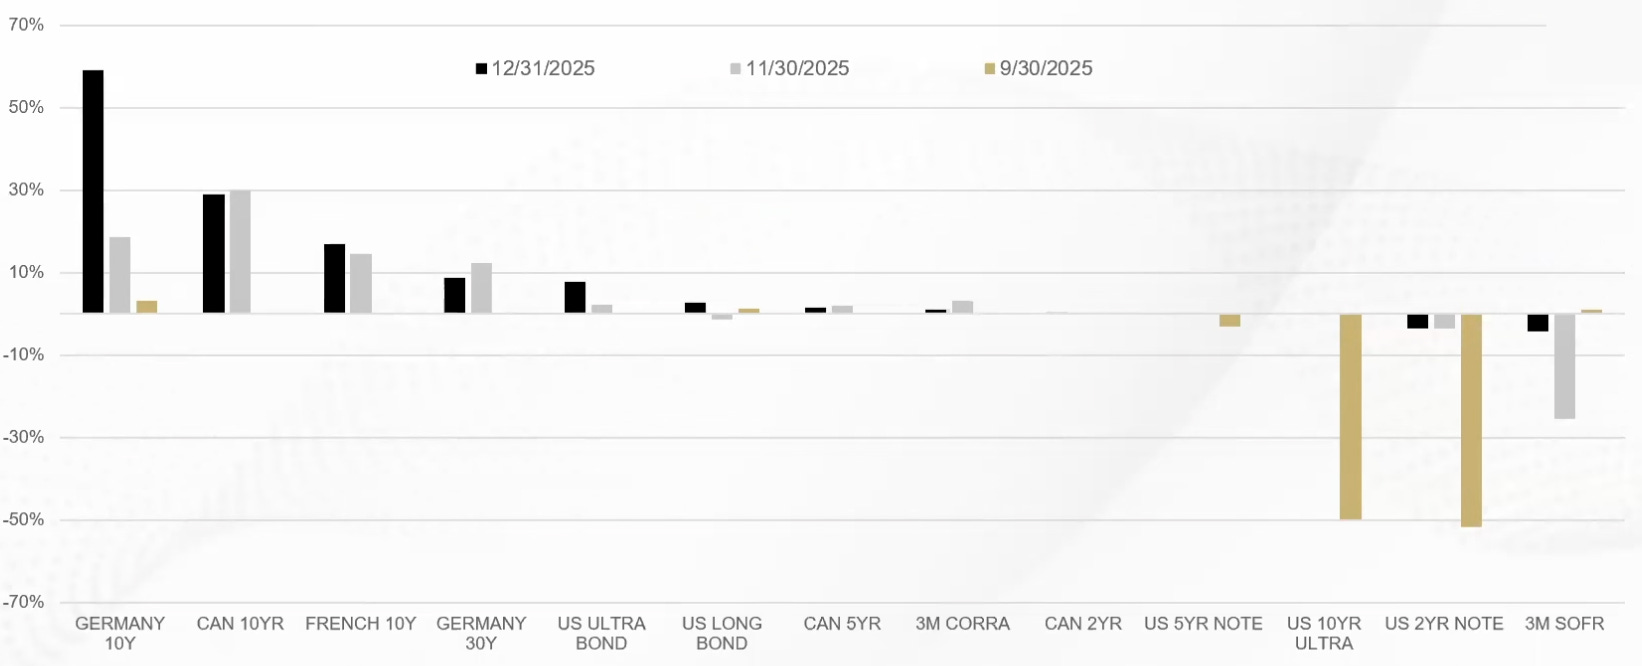
The following chart shows current exposures as well as recent exposures which highlights the adaptive nature of the strategy.
Exposures
Commodity Exposures
Interest Rate Exposures
The Performance
For the Quarter
These exposures underperformed the world equity benchmark and underperformed the world bond benchmark.
Key Contributors
The positive contributors were the exposures as seen below:
Silver
Gold
Copper
Platinum
Sugar
The negative contributors were the exposures as seen below:
Live Cattle
Cattle Feeder
Natural Gas
WTI Crude
Cocoa
For the Year
These exposures underperformed the world equity benchmark and underperformed the world bond benchmark.
The year was split into 2 halves: Pre-Liberation Day and Post-Liberation Day.
Pre-Liberation Day trend following did well but Post-Liberation Day there were significant counter trend reversals which were historically abnormal both in terms of speed and magnitude.
Shortly after Liberation Day, global growth expectations materially decelerated as well as commodity prices and naturally equity prices given the expectation that material tariffs would slam the breaks on growth, consumption, and therefore prices.
Yet for the rest of 2025, equities roared higher which normally indicates growth accelerations and yet if one allocated to growth oriented commodities (things used in industry like oil, gas, copper, etc) one would have performed poorly with the exception of precious metals (like gold and silver) which normally do well when growth concerns abound.
The equity rally overall was a greater reflection of its concentrated exposure to companies materially tied to the CAPEX boom in AI spending instead of a broad reflection of broad economic reality.
Key Contributors
The positive contributors were the exposures as seen below:
Gold
Silver
Live Cattle
Cattle Feeder
Platinum
The negative contributors were the exposures as seen below:
Cocoa
WTI Crude
Gasoline
Soybean Oil
Canadian 10 Year Bonds
Gresham’s Wrath (Gold Bullion with a Twist)
The Summary
Gold is a chemical element that has historically been the premier form of commodity money because of its unique physical properties.
It is chemically stable and virtually indestructible, meaning almost all the gold ever mined is still in existence. This durability, combined with its geological rarity, gives gold the highest stock-to-flow ratio of any physical commodity, with new annual production consistently adding only about 1.5% to the existing supply.
This reliable scarcity makes gold a superior store of value, as its supply cannot be easily increased even when its price rises, thus protecting it from the debasement that has plagued other forms of money throughout history.
For a deeper dive into why we allocate to gold checkout the post below:

The Exposure
This exposure is one that we helped create and was inspired by our work in applied history which we define as a practical tool that uses the laboratory of the past to better understand and navigate the complexities of the present and future.
We observed that Gresham’s Law states “bad money drives out good money” i.e. people rapidly spend the less valuable money and hoard the most valuable money.
For example, you spend in credit ledger money for consumption needs (like food) but save in commodity ledger money for savings needs (like gold).
We also considered a common criticism from fiat enthusiasts that gold does not provide a yield or income and is therefore less valuable.
Despite this not being the fatal defect that fiat enthusiasts think it is, we nevertheless considered this observation.
We ultimately merged these two observations into an exposure that we call “Gresham’s Wrath”.
It is a magnified gold exposure that also generates income.
Specifically, it is the combination of two different strategies:
First, we get 1.5X exposure to the price of gold. For example, if the gold price goes up 10% then this exposure would likely be up 15%. Economically, it buys $10 of gold with cash and then borrows the remaining $5 to buy the remaining gold position which results in a total gold exposure of $15. As institutional investors in global capital markets, we are able to borrow at an interest rate in the low single digits. Thus, we are economically borrowing a debasing credit ledger money whose interest costs are in the low single digits to buy a debasement resistant commodity ledger monetary reserve asset.
Second, we layer on the selling of put spreads to generate option income. This is akin to selling a fire insurance policy that lasts for 2 weeks before it expires for a price of $10 and then buying firestorm reinsurance for $1 thus pocketing $9 for the two week period. By renewing this “fire insurance policy” every two weeks we expect over the long term to generate a modest amount of additional income in a very prudent manner.
Finally, at the 50,000 ft altitude of analysis, you will see that
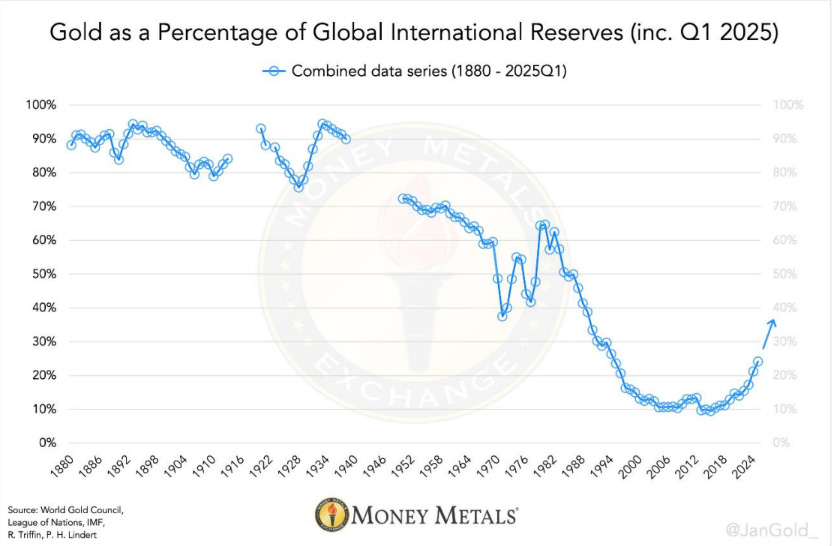
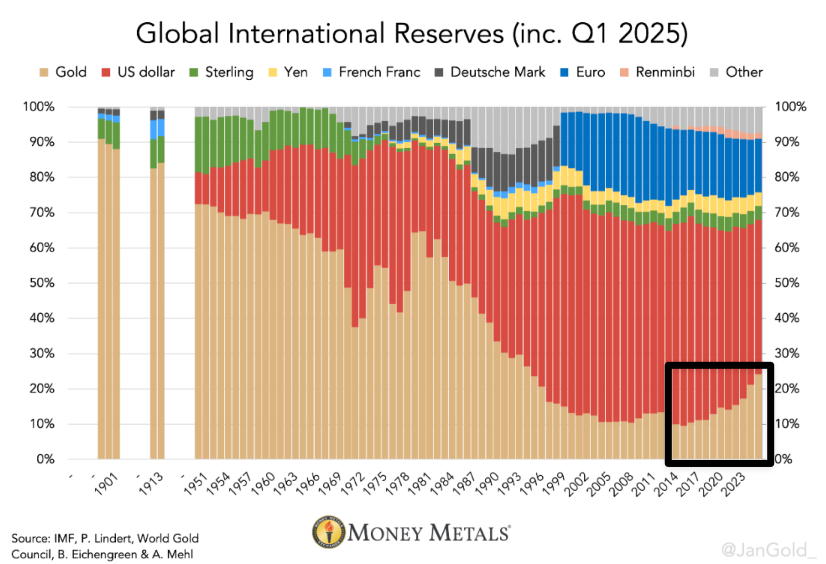
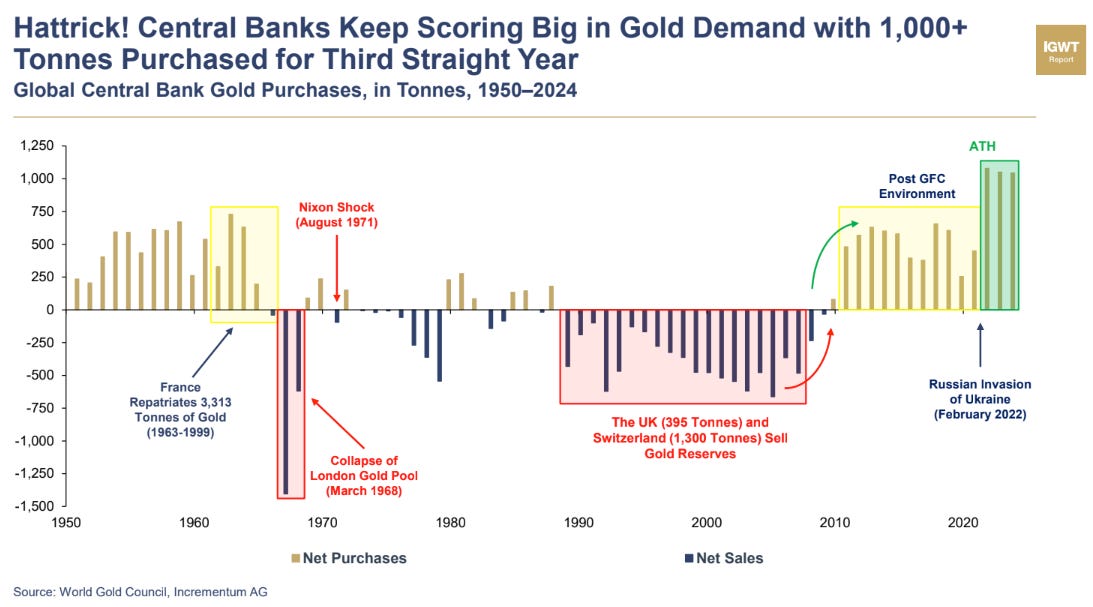
Gold demand from global central banks is accelerating at the same time US Treasuries are being reduced.
Gold demand from global central banks intensely accelerated after the start of Russia’s invasion of Ukraine.
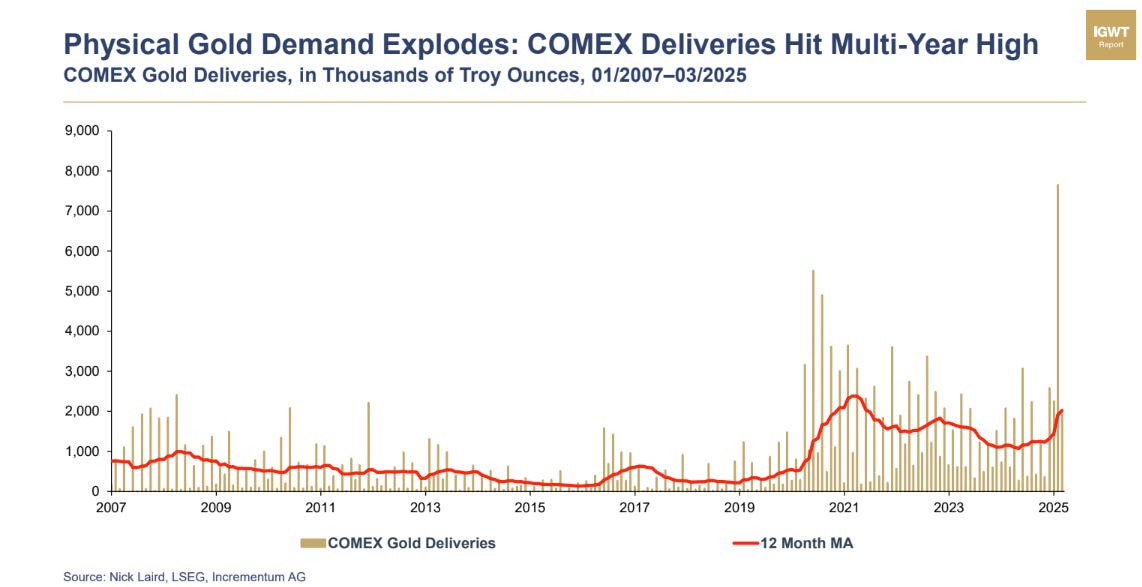
Gold exposure is being specifically expressed via physical deliveries which highlights growing mistrust.
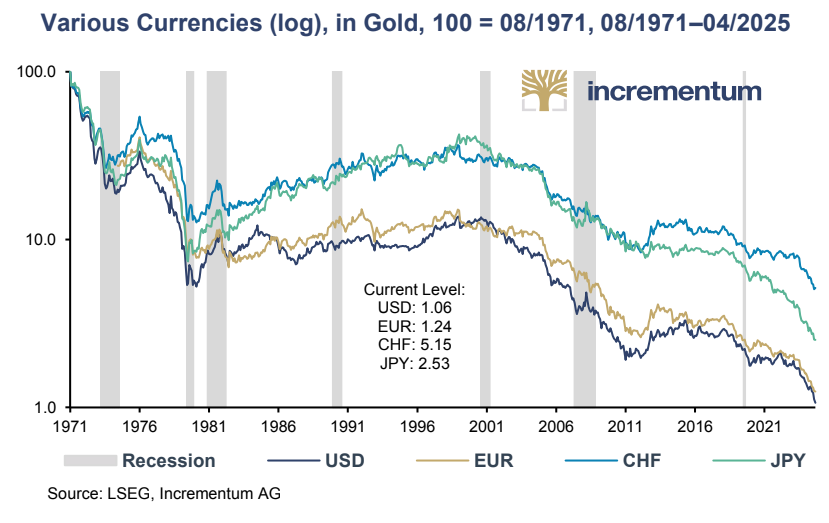
The top global fiat currencies (USD, EUR, GBP, CHF, JPY, etc) have all lost material value relative to gold once they were severed from the gold link in 1971. In fact, the best performing fiat of the Swiss Franc (CHF) “only” lost 93% of its value.
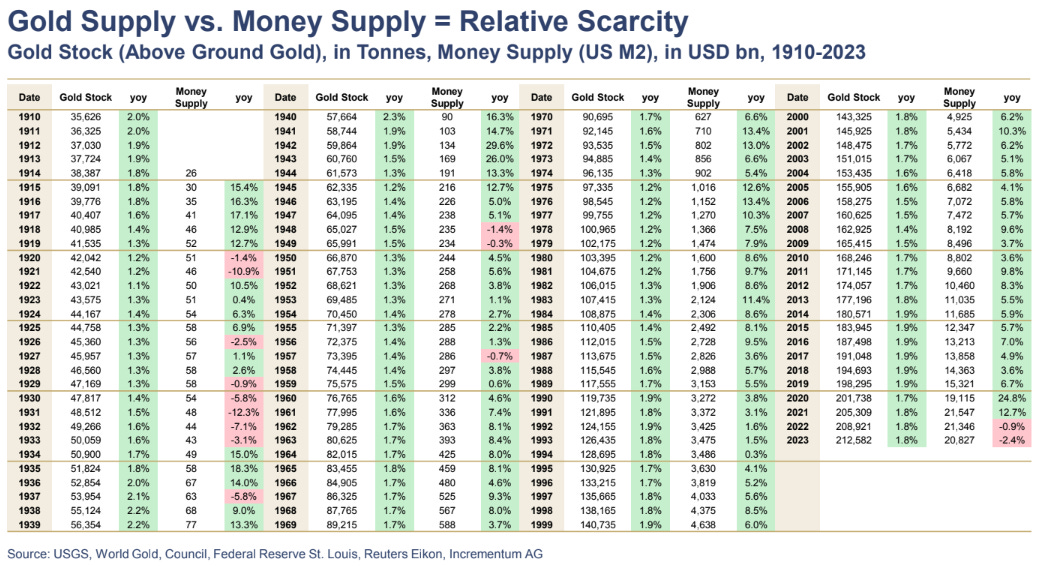
Over the past 109 years, the gold supply has increased from 38,387 tones in 1914 to 212,582 tonnes in 2023 which is an annualized increase of 1.59% per year which favorably compares to the USD supply of 26 billion in 1914 to 212,582 billion in 2023 which is an annualized increase of 8.61%. Thus, the real rate of annualized USD Fiat debasement is closer to the high single digits as opposed to the low single digits so commonly cited by fiat enthusiasts.
The Performance
For the Quarter
This position materially outperformed the world equity benchmark and materially outperformed the global bond benchmark.
For the Year
This position materially outperformed the world equity benchmark and materially outperformed the global bond benchmark.
Disclaimer
This website is not an offer or solicitation in any jurisdiction in which the firm is not registered. Information presented is for educational purposes only. It should not be considered specific investment advice, does not take into consideration your specific situation, and does not intend to make an offer or solicitation for the sale or purchase of any securities or investment strategies. The services, securities and financial instruments described on this website may not be suitable for you, and not all strategies are appropriate at all times. Investments involve risk and are not guaranteed. Past performance is not necessarily a guide to future performance. Independent advice should be sought in all cases.
TYME Advisors is a U.S. Securities and Exchange Commission (SEC) Registered Investment Advisor . Registration does not imply a certain level of skill or training. Information about the firm including the Customer Relationship Summary is available on the SEC’s website at www.adviserinfo.sec.gov. Information about our privacy policy is located here.