Q3 2025 Portfolio Commentary
A Long/Short Longboat Update

This commentary is based upon client quarterly portfolio reports.
It is intended as supplementary material to those reports.
Investing is a means to an end and is step 3 in our financial planning process.

That end is accomplishing your financial goals per your custom financial plan.
Every financial plan has an implied required return (RR) that must be earned over the long term for the portfolio to do its part in making a financial plan robust.
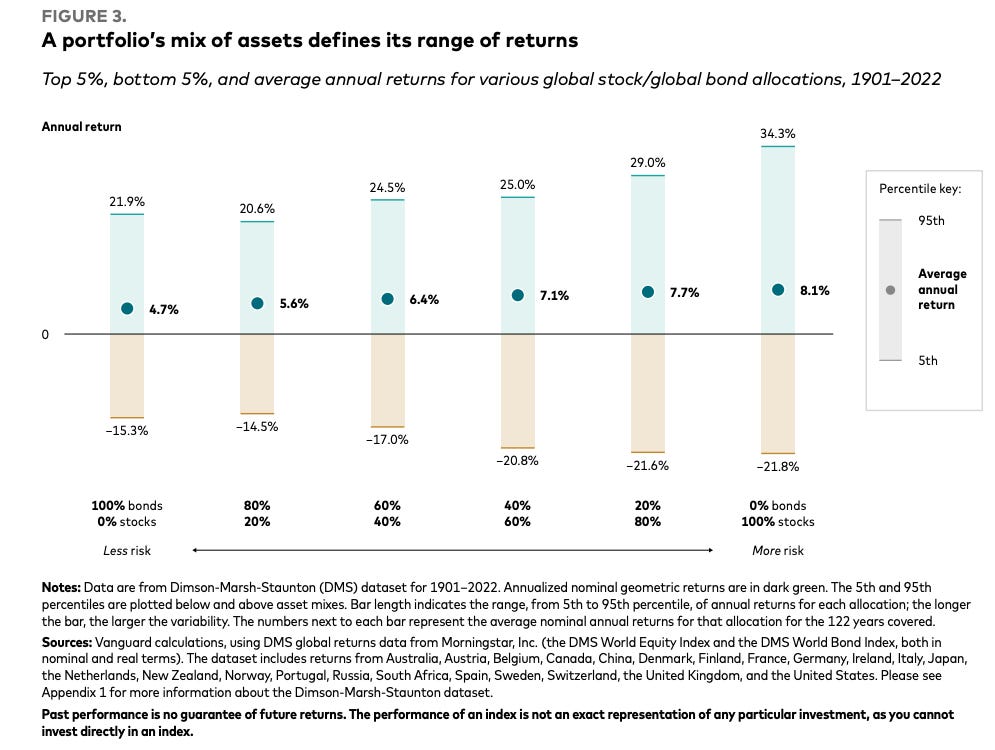
Furthermore, the following is a good expectations cleanser.
It shows the top 5%, bottom 5%, and the average annual return for various global stock/global bond allocations looking back 120+ years (1901–2022).
It illustrates the historical range of possibility (extreme good annual return, extreme bad annual return, and average annual return) by different portfolio types from the least risky allocation (100% bonds on the left) to the most risky (100% stocks on the right).
With that said, let us compare how the managed portfolios have performed relative to their respective RR and to their respective comparable low cost publicly traded diversified portfolio benchmarks.

Aggressive Portfolios
Relative to the Required Return (RR)
For the Quarter
They materially outperformed their RR benchmarks.
For the Year
They materially outperformed their RR benchmarks.
Relative to Comparable Portfolio Benchmarks
For the Quarter
They materially outperformed their aggressive portfolio benchmarks.
For the Year
They materially outperformed their aggressive portfolio benchmarks.
Moderate Portfolios
Relative to the Required Return (RR)
For the Quarter
They materially outperformed their RR benchmarks.
For the Year
They materially outperformed their RR benchmarks.
Relative to Comparable Portfolio Benchmarks
For the Quarter
They materially outperformed their moderate portfolio benchmarks.
For the Year
They materially outperformed their moderate portfolio benchmarks.
Cash Reserve Portfolios
Relative to Comparable Portfolio Benchmarks
For the Quarter
They performed in line with their cash reserve portfolio benchmarks.
For the Year
They performed in line with their cash reserve portfolio benchmarks.
The Equity Sleeve
The Performance
For the Quarter
It was materially positive and in line with the world equity benchmark.
The Attribution
Key Contributors (added value during the period)
Precious Metal Royalty/Streaming Companies
Global Armaments
Key Detractors (subtracted value during the period)
West Texas Real Estate
A Defense and Aerospace Component Manufacturer
Japan
New Positions
A Systematic Long/Short Extension
This position only applies to those with large taxable account balances.
This takes tax loss harvesting 1.0 and upgrades it to tax loss harvesting 2.0.
It improves after-tax wealth compounding within a risk-managed framework and has several practical uses, including diversifying concentrated stocks, revitalizing "frozen" taxable accounts with large unrealized capital gains, and building up tax losses to offset future gains.
For a deeper dive, checkout the post below:

They were in line with its benchmarks and also reduced concentrated positions with significant embedded gains and yet only realized net short term losses.
Going long means making money when prices rise. This is buying low then selling high.
Going short means making money when prices fall. This is selling high then buying low.
These net short term realized losses were primarily from closing out short positions which makes sense given stocks rallied up for the quarter.
Exited Positions
A Multinational Military Technology and Armaments Manufacturer
We exited this position because our other exposures to global armaments already had a material exposure to this same company and we didn’t want undue concentration.
A Payment Processing Company
We exited this position because our other exposures to US Large Caps already had a material exposure to this same company and we didn’t want undue concentration.
A Defense and Aerospace Component Manufacturer
We exited this position as the incoming bottom up quantitative signals from Mr. Market began to indicate unfavorable weather patterns for this exposure.
Maintained Positions
High Quality US Large Companies
The Summary
This exposure consists of US Large Companies and then seeks to earn superior long term returns with lower downside risk by filtering out junk companies (overvalued and low quality companies run by poor management teams).
It filters out these factors which are a concentrated source of downside risk:
High External Financing: companies that are over reliant on external capital through high debt or stock sales (i.e. a farmer who keeps selling his land to buy seeds for planting crops).
Wealth Destroyers: companies that reinvest cash flow but generate economic returns below their cost of capital (i.e. borrow at 8% to earn 2% which destroys 6%).
Value Traps: companies where intrinsic value is lower than book value (i.e. a home that seems cheap on a price per square foot basis but it has a cracked foundation, rotted support beams, etc).
The Performance
For the Quarter
This position outperformed the world equity benchmark.
Key Contributors
The primary contributors to this outperformance were our exposures to
Global Armaments
The Summary
This exposure focuses on companies that make armaments for nation state security.
Our deep dive into the state of global armaments:
Global Armaments

Let us examine the question of armament spending thru our applied history framework, which we see as a practical tool that uses the laboratory of the past to better understand and navigate the complexities of the present and future.
North America
The latest US defense budget proposal continues a trend of significant growth, pushing toward the trillion-dollar mark.
An analysis from the American Enterprise Institute shows the 2026 budget request continues a steep climb in spending, reflecting a strategic shift toward a world of renewed great power competition and away from one tuned for the global war on terror.
But beyond the headline numbers, a closer look reveals a clear and large bet: the Pentagon is prioritizing the development of next-generation technology over the mass production of weapons we have today.
In the proposed 2026 budget, every branch of the military sees a funding increase.
This spending surge is heavily weighted towards Research, Development, Test, and Evaluation (RDT&E).
The top two largest funding increases by account are for Air Force RDT&E (+$15.4B) and Space Force RDT&E (+$10.5B).
Key program winners include:
Classified Programs: The largest single increase, with a staggering $13.8 billion boost.
Nuclear Modernization: Programs like the B-21 Raider bomber (+$5.0B), Sentinel ICBM (+$2.1B), and the Columbia Class Submarine (+$1.6B) are receiving massive investments to overhaul the nation's nuclear triad.
Moreover, it appears the US is seriously considering focusing security concerns in the Western Hemisphere as opposed to focusing efforts on countering Russia and China.
This is a radical departure from past policy and has significant implications for Europe and Asia Pacific.
Europe
European nations are being compelled to dramatically increase defense spending due to a confluence of direct threats and shifting alliances.
The primary catalyst is the evolution of the war in Ukraine, which has transformed into a futuristic “drone war”. This new form of warfare, characterized by swarms of lethal drones, is no longer confined to Ukraine.
Russia is actively testing NATO’s resolve by sending drones and fighter jets into the airspace of member states like Poland, Romania, Estonia, and Denmark, sending a clear message that what is happening to Ukrainian cities could happen to them.
This urgent need for rearmament is magnified by a significant shift in U.S. policy under the Trump administration.
The U.S. has largely withdrawn from direct military support for Ukraine, effectively making the conflict “their problem” for Europe to solve. President Trump now speaks of NATO as a third party, signaling a retreat from America’s traditional security role on the continent.
With the U.S. stepping back, it is “crystal clear” that European nations must fill the void by both funding Ukraine’s war effort and rapidly rebuilding their own depleted militaries.
The current level of European aid to Ukraine is 0.1% of their annual GDP i.e. a “minor effort,” necessitating a massive acceleration in both financial support and weapons production.
Our applied history framework illustrates that a failure to deter is a broadcast of weakness which is an invitation to an aggressor to achieve its geopolitical goals by kinetic means.
“You probe with bayonets: if you find mush, you push. If you find steel, you withdraw”
― Vladimir Ilich Lenin
Europe’s current military posture is perceived as weak, and Russia’s repeated airspace violations are a direct consequence of this lack of a credible deterrent.
Europe faces a stark choice: either rearm on a massive scale to “impose more pain on Russia” and enable a serious negotiation, or be forced into a diplomatic compromise from a position of weakness.
Asia Pacific
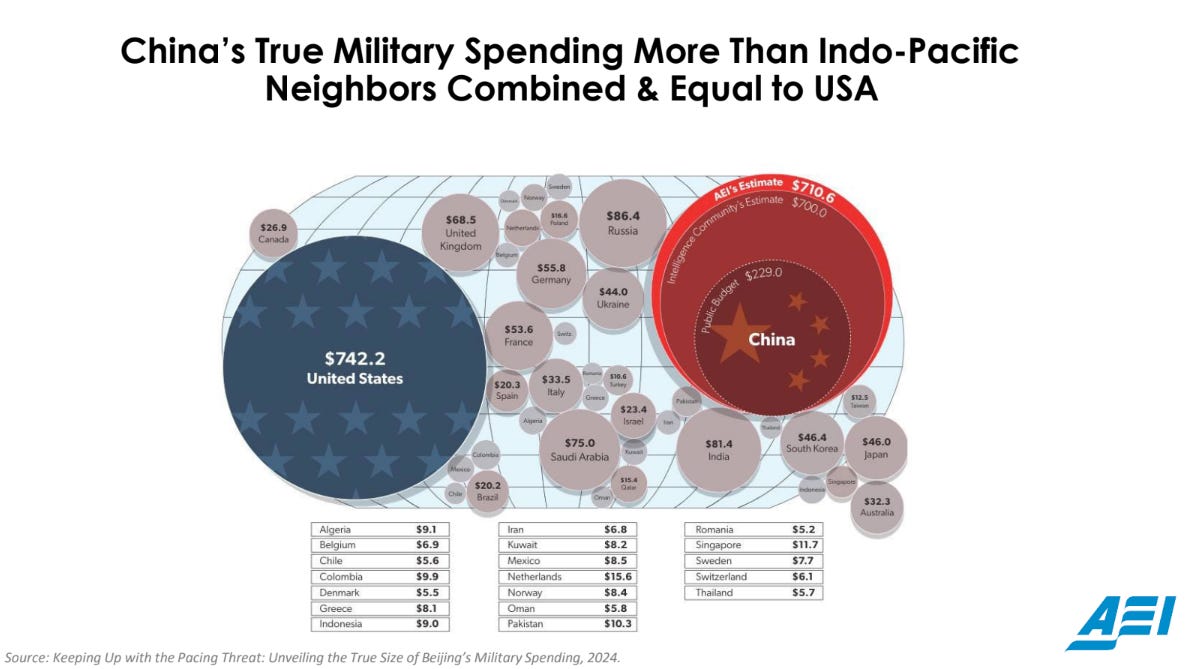
China significantly underreports its defense budget.
While official figures claim around $229 billion (as of 2022), intelligence communities estimate the true spending to be closer to $700 billion, comparable to the United States’ defense budget. This discrepancy arises because China omits several major categories of expenditures from its official military budget.
These uncounted expenditures include:
Coast Guard and People’s Armed Police: These forces are used for military purposes, such as ramming Filipino vessels in disputed waters, but their costs are not reflected in the defense budget.
Military Research and Development (R&D): China reports negligible spending on military R&D, despite clear evidence of advanced military development.
Mobilization, Retirement Pensions, and Base Construction: These significant costs are also excluded from the official figures.
Intellectual Property Theft: China extensively steals intellectual property, particularly from the U.S., allowing them to copy designs for aircraft, ships, and missiles. This theft de-risks their development process, leads to fewer failures, and significantly reduces their R&D costs, effectively operating as an uncounted subsidy.
Military-Civil Fusion: China’s policy blurs the lines between civilian and military spending, with commercial industries like shipbuilding also contributing to military capacity. This includes substantial government subsidies to prop up military-related industries.
These hidden costs and practices mean China’s military spending is much higher and more efficient than publicly stated, especially when factoring in the lower cost of labor and the concentrated focus of their military efforts on the Asia-Pacific region.
If this strategy of economic sleight-of-hand feels familiar (to those who read history), it should.
We’ve seen this playbook before, in the smokestack-filled skies of 1930s Germany, right before the world plunged into war.
The Echoes of Territorial Ambition: Germany in the 1930s
Germany similarly engaged in secretive rearmament efforts in the 1920s and 1930s, circumventing the Treaty of Versailles which forbade them from building a military air force.
Key methods of concealment and obfuscation included:
Military-Civil Fusion: German aviation engineers secretly designed military aircraft under the pretense of producing civilian planes. For example, the Heinkel He-51 was officially a training aircraft but functioned as a fighter plane, and the Junkers Ju-52, a civilian airliner, was developed to be a troop transporter and bomber.
Offshore Testing and Training: To further hide their intentions, these newly designed military aircraft were tested in Soviet Russia. This secret collaboration allowed Germany to develop military bases deep in Russia and train a new generation of fighter pilots and air force officers (similar to China and Russia now).
By 1936, Germany’s aviation factories outstripped those of Britain and America combined, demonstrating the success of their covert and heavily funded rearmament program. By 1939, the Luftwaffe became the largest and best-equipped air force globally with 4,000 advanced warplanes.
Both China and Germany employed deceptive financial and operational strategies to mask the true scale of their military buildup, allowing them to rapidly expand their military capabilities while presenting a different public image.
On the whole, the entire world is rapidly rearming.
The Performance
For the Quarter
This position outperformed the world equity benchmark.
Key Contributors
The top three contributors to this outperformance came from
Palantir (US Defense Tech)
Kratos Defense & Security Solutions, Inc. (US Defense Tech)
RTX Corporation (US Defense Tech)
Japan
The Summary
This exposure focuses on owner operator companies that serve the local Japanese market.
Our deep dive into Japan:
Japan

These factors among many more collectively create a compelling case for the continued growth and potential of Japan’s equities.
We have chosen an exposure that starts with a universe of 4,000+ companies and filters out 99% of those companies.
Then, the investment is allocated to approximately 30-50 companies with the following characteristics:
Authentic Japanese Exposure: Unlike common Japanese exposures which are heavily weighted to large multinationals with significant global business, this exposure targets companies with locally sourced revenues i.e. genuine exposure to the Japanese economy.
Alignment of Economic Interests: By focusing on owner-operators (management personnel who have significant ownership stakes in their businesses), we get exposure to management that is incentivized to maximize return on equity, return on invested capital, and shareholder returns.
Compelling Opportunities at a Bargain Price: Generally, the Japanese market is cheap relative to its developed-market peers which minimizes the risk of overpaying. This cheapness does not mean we are buying low quality. In fact, we are paying a low price to buy high quality businesses (high profits, strong balance sheets, little debt, management incentive alignment, etc) which materially improves the risk adjusted return potential.
Why is the owner operator attribute so important in Japan?
Great question!
Traditional Lifetime Employment System: This model discourages risk-taking and innovation within established companies. Thus, Japanese entrepreneurs gravitate towards an owner-operator model (management personnel are large shareholders), giving them the freedom to pursue new business ventures. As such, Japanese entrepreneurs are motivated to maximize returns for shareholders (us).
Innovation: Japan is a significant source of innovation, ranking third globally in patent filings behind China and the USA.
Foreign Competition: This is limited in Japan due to language barriers and closed corporate structures that restrict information flow.
Mature Economy: Its declining population and aging society disincentivizes global competition from entering the local Japanese market. Thus, Japanese entrepreneurs have competitive moats over their stagnant corporate peers at home and distant investors abroad when it comes to opportunistically implementing and monetizing innovative ideas and business growth plans.
The Performance
For the Quarter
This position underperformed the world equity benchmark.
Key Contributors
The top three contributors to this underperformance came from:
Digital Assets: Bitcoin
The Summary
Bitcoin (BTC) is the hardest money ever created, emerging at the precise moment the global long-term debt cycle is showing terminal signs of stress, offering us a rational and essential tool for preserving wealth in an era of unprecedented monetary debasement.
Yes, we are aware Bitcoin is not an equity but we assign it to the risk sleeve for risk management and portfolio management reasons.
Our first principles look at Bitcoin is the foundational reason for our exposure:
From Gold to Code

A first-principles look at the history of money and why Bitcoin is a possible ally for proponents of sound money.
The summary of what we find most compelling:
Absolute Scarcity: Bitcoin achieves absolute scarcity with a mathematically enforced hard cap of 21 million coins, a feature no physical commodity has ever had. This predictable and finite supply makes it a superior long-term store of value, as a higher price only increases the network’s security, not the creation of new coins.
Decentralized, Trustless Ledger: The network is a decentralized and trustless ledger, where transactions are verified by cryptographic proof and energy rather than by fallible third parties like banks or governments. This design allows anyone to send value directly to another person without permission, creating a neutral settlement asset free from counterparty risk.
Closes a 150-Year Technological Gap: For 150 years, a “speed gap” has existed between fast digital transactions and the slow, physical settlement of hard assets like gold, necessitating centralized intermediaries. Bitcoin closes this gap by being the first scarce, bearer asset that can be settled globally at nearly the speed of light.
Enables Individual Sovereignty: By allowing users to be their own bank, Bitcoin provides a powerful tool for individual sovereignty, enabling wealth to be held and transferred without permission. This censorship-resistance makes it a “monetary lifeboat” for those living under authoritarian or high-inflation regimes, as value can be stored in a key phrase and accessed anywhere in the world.
Immutable and Antifragile: The network’s decentralized consensus makes its core rules, especially its 21 million coin supply, immutable and resistant to change. Furthermore, Bitcoin is antifragile—it grows stronger from attacks and disorder, as each failed attempt to compromise it only serves to prove its resilience and harden its security.
These characteristics are especially attractive in the context of a world reversing from globalization back to regionalization with growing distrust between multiple layers of society (nations, central banks, governments, citizens, etc).
Moreover, history shows monetary debasement often accelerates when governments aim to restructure society but want to avoid the short term pain required and thus succumb to the temptation to create more money.
The Performance
This position underperformed the world equity benchmark.
Precious Metal Royalty/Streaming Companies
The Summary
This provides us with a diversified exposure to precious metals, benefiting from both price appreciation and production growth without the operational risks of mining. Additionally, these exposures typically do well when traditional exposures do not and thus provides potent equity portfolio diversification.
Exposure 1
Royalty and Streaming Financier: It provides upfront capital to mining companies in exchange for either a royalty (a percentage of the mine’s future revenue) or a stream (the right to buy future metal production at a fixed, low price). It is a financier, not a mine operator.
Holds a Vast, Diversified Portfolio: Its assets include hundreds of royalties and streams, primarily in gold, but also silver, platinum group metals, and other commodities. This diversification across different assets, geographies, and operators significantly reduces single-project risk.
Maintains Exposure to Oil & Gas Royalties: Uniquely among its peers, it also holds a significant portfolio of oil and gas royalties. This provides an additional layer of commodity diversification and a hedge against different economic cycles.
Gains “Free” Optionality on Exploration: A core part of its model is acquiring royalties on vast land packages. If the mining partner discovers more resources on that land, its royalty interest applies to the new discoveries without it having to invest another dollar in exploration or development costs.
Exposure 2
Pioneered the Precious Metals “Streaming” Model: It specializes in streaming agreements. They make a large, upfront payment to a mining company and in return receive the right to buy a percentage of that mine’s future gold or silver production at a deeply discounted, fixed price (e.g., ~$400/ounce for gold).
Targets By-Product Metals from Base Metal Mines: A key strategy is to provide capital to miners of base metals like copper or zinc. These miners often treat the gold and silver produced alongside their primary metal as a secondary “by-product.” It unlocks the value of these precious metals for the miner, securing the stream for themselves.
Secures Contracts on Large, Long-Life Assets: It focuses on partnering with major mining companies on large-scale, low-cost mining operations. This ensures their streams are tied to assets that will be producing metal for decades, providing highly predictable, long-term cash flow.
Creates Massive Margin Expansion: Because its purchase price is fixed by contract, its profit margin expands dramatically as the spot price of gold and silver rises. Unlike a miner, its costs do not inflate with the price of the commodity, a key feature for an inflation hedge.
Offers a “Pure-Play” Streaming Investment: It focuses exclusively on precious metals streaming, primarily gold and silver. This provides us with direct, high-leverage exposure to precious metals prices without the complexities of other commodities or royalty types.
What they have in common:
Buy Low ; Sell High: Royalty/Streaming companies provide upfront capital to mining companies in exchange for the right to receive a portion of future production (typically gold, silver, or other precious metals) at a fixed, discounted price or as a percentage of output.
Avoids Cost Overruns: Unlike traditional miners, royalty/streaming companies do not operate mines themselves; they earn revenue streams based on the exploration and production activities of third-party operators/miners.
Capital Light Businesses: These companies are considered "capital-light" because they avoid the significant capital expenditures, operating costs, and post-production liabilities associated with direct mining operations.
Positive Asymmetric Optionality: This structure offers "asymmetric optionality": revenues can increase both from higher metals prices and from increased production at the underlying mines, while the company itself bears minimal ongoing costs.
Inflation Protection: Precious metals generally perform well in inflationary environments, and these companies provide magnified exposure to these price movements, making them potentially inflation beneficiaries.
All-Weather Resilience: They can perform well in various economic regimes (high/low growth, high/low inflation), not just during inflationary periods.
Long-Duration Assets: Many agreements are tied to long-life mines, sometimes with decades or even centuries of production potential, providing enduring revenue streams.
Optionality and Scarcity Value: As new mine discoveries become rarer and existing high-quality assets more valuable, holding royalties/streams on these assets becomes increasingly advantageous.
Mine Diversification: Royalty/Streaming companies often hold interests in multiple mines and jurisdictions, reducing concentration risk and increasing the stability of cash flows.
The Performance
For the Quarter
This position materially outperformed the world equity benchmark.
Key Contributors
The top contributors to this outperformance came from:
West Texas Real Estate
The Summary
This is West Texas Real Estate along with the associated oil, gas, and water rights.
Exposure 1
Vast, Perpetual Land Holdings: It is one of the largest private landowners in Texas, with approximately 870,000 acres of surface estate and 2.4 million acres of mineral interests, primarily in the Permian Basin. Additionally, this exposure is located in District 8 which is responsible for about 20% of all oil and gas production in the U.S. This land is a finite, irreplaceable asset that cannot be replicated.
High-Margin Royalty Income: It owns perpetual oil and gas royalty interests on hundreds of thousands of acres. This generates high-margin revenue from energy production without the associated capital expenditures or operating risks of exploration and production companies.
Capital-Light Compounding Machine: The business model requires minimal capital investment to generate revenue, leading to extremely high free cash flow. This cash can be used for dividends, share buybacks, and acquiring more royalty assets, creating a powerful compounding effect over time.
Zero Debt: It has a pristine balance sheet with no debt, making it incredibly resilient through all economic cycles.
Multi-Faceted Revenue Streams: Beyond oil and gas, it generates revenue from surface leases, easements for pipelines, water sales, and other commercial activities, providing diverse and growing income streams.
Exposure 2
Modern, Focused Asset Base: It controls approximately 220,000 surface acres and 8,000 gross mineral acres in and around the Delaware Basin, a highly active sub-basin of the Permian. Its holdings are strategically located to service modern energy development.
Explicit Focus on New Infrastructure: It was structured from the start to capitalize on the infrastructure needs of the 21st century. It has an explicit strategy of leasing its land for data centers, Bitcoin mining facilities, and other large-scale industrial projects by offering unique advantages for them such as abundant and cheap natural gas for power generation, extensive water resources for cooling, an unregulated power grid, and low existing populations so there is little to no competition between citizens and business for access to said resources.
Strategic Water Business: A core part of its strategy is its water business, including providing produced water management (e.g., saltwater disposal) and developing water infrastructure, which are critical services for energy producers in the region.
What they have in common:
Hard Asset Focus: Both are pure-play land and resource companies. Their value is tied directly to tangible, finite assets rather than intellectual property or manufacturing processes.
Inflation Beneficiaries: Their revenues from royalties and leases are intrinsically linked to commodity prices and economic activity, making them excellent hedges against monetary inflation.
Capital-Light Business Model: Both primarily lease their assets to others and collect high-margin fees and royalties, avoiding the heavy capital costs and operational risks of their tenants (e.g., oil drillers, data center operators, bitcoin miners, etc).
Permian Basin Location: Both are strategically centered in the Permian Basin, the most prolific and economically viable oil and gas producing region in North America.
The Performance
These exposures underperformed the world equity benchmark.
Key Contributors
The top contributors to this underperformance came from
Capital Markets Exchanges
The Summary
These are essential, high-margin “toll roads” for the economy. They have immense operating leverage, meaning once their infrastructure is in place, revenue from increased trading volume flows directly to profits with minimal extra cost. Furthermore, their revenue is naturally hedged against inflation, as it’s tied to the nominal value of transactions, and they benefit from strong network effects and high regulatory barriers that create a durable competitive advantage.
Exposure 1
Market Technology/SaaS Provider: It licenses and sells its critical trading, clearing, and surveillance technology to over 130 other exchanges, regulators, and financial institutions worldwide. This is a high-margin, software-as-a-service (SaaS) business.
Listing Services: It operates a critical US stock market, where companies pay initial and recurring fees to list their shares for public trading. This creates a durable, long-term revenue stream.
Data & Indexing: The company collects vast amounts of proprietary market data (like quotes and trades) and sells it to a wide range of customers. It also creates and licenses its influential indexes to providers of exchange-traded funds (ETFs) and other financial products for a fee based on the assets under management (AUM).
Trading & Clearing: It earns transaction fees from the buying and selling of securities (stocks, options) on its exchanges and provides clearing services to ensure those trades are settled.
Exposure 2
Proprietary, High-Demand Products: Unlike other exchanges that just trade other companies' stocks, it owns unique, indispensable products that it created. Key examples include:
The VIX: This index is the globally recognized standard for equity market volatility. It has a monopoly on VIX options and futures, which are essential for hedging.
SPX Options: It has exclusive rights to options on the S&P 500 index, the most important benchmark for the U.S. stock market.
Leader in Secular Growth Trends: It is at the center of the explosive growth in index options and derivatives used for sophisticated hedging and income-generating strategies, including the recent rise of Zero-Days-to-Expiration (0DTE) options.
Pricing Power: Because it owns these exclusive, must-have products, it has significant power to set the fees for trading them, protecting its high margins.
What they have in common:
Consistent Trading Fee Generation: Exchanges, as toll booth operators, are the only consistent beneficiaries of trading activity over time. While most market participants are engaged in a zero-sum game, exchanges reliably earn fees from every transaction, regardless of market direction or participant success.
Recurring Revenue from Data Sales: Exchanges own and sell vast amounts of proprietary market data to traders, hedge funds, and media outlets. This is a high-margin, recurring, and growing revenue stream.
Asset-Light, High-Margin Business Model: Like royalty/streaming companies, exchanges operate with minimal capital requirements and have high cash operating profit margins. They are largely insulated from balance sheet vulnerabilities since they do not require significant borrowing or capital investment.
Breadth of Economic Exposure: Unlike royalty/streaming companies, which are typically tied to a single commodity or sector, exchanges benefit from a broad array of economic activities. They participate in every market large enough to require centralized, regulated trading—including equities, bonds, commodities, derivatives, and increasingly, digital assets.
Resilience and Adaptability: Many exchanges are among the oldest continuously operating businesses, having adapted to technological and regulatory changes over centuries (for example the London Stock Exchange has its roots in Jonathan’s Coffee-House circa 1698). Their business model remains robust and relevant, even as new asset classes (such as digital assets) emerge.
Beneficiaries of Volatility and Innovation: Exchanges often see increased earnings during periods of market volatility and uncertainty, as trading volumes and spreads rise. They also stand to benefit from innovations like blockchain and digital assets, which can significantly expand the universe of tradable instruments.
Limited Competition and Regulatory Moats: There are typically only a handful of regulated exchanges in each country, often due to regulatory preference for fewer, more easily supervised entities. This limited competition supports pricing power and high profitability.
The Performance
For the Quarter
These exposures underperformed the world equity benchmark.
Key Contributors
The top contributors to this underperformance came from
The Alternative Sleeve
The Performance
For the Quarter
This position outperformed the world equity benchmark and the world bond benchmark.
As a reminder, the alternatives we consider are designed to generate returns that are low to negatively correlated to both equities and bonds (zigs when equities and or bonds zag).
The Attribution
The top contributors to this outperformance came from:
Gresham’s Wrath (Gold Bullion with a Twist)
New Positions
None
Exited Positions
None
Maintained Positions
Managed Futures
The Summary
An exposure designed to generate absolute returns, low correlations to equities (zigs when equities and or bonds zag), and help manage downside risk during risk-off events.
Going long means making money when prices rise. This is buying low then selling high.
Going short means making money when prices fall. This is selling high then buying low.
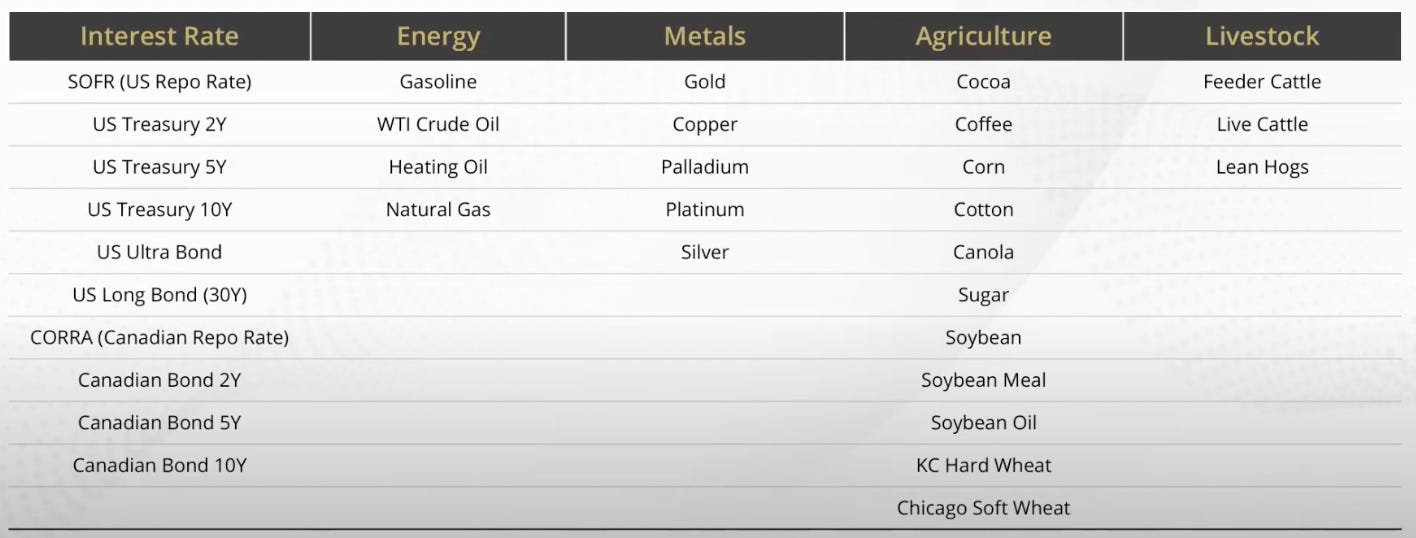
Below represents the different exposures that we can go long or short by asset class and instrument.
This position uses multiple models which are each designed to capture different market dynamics.
Price Trend: aims to perform during periods of disruption, high volatility, and outsized moves in price.
Fundamental Reversion: detects when markets have moved too far from fair value, seeking to deliver returns during periods of lower/falling volatility.
Carry: looks to perform during periods of flat or falling interest rates.
Risk-Off: seeks to capture upward/downward.
With regards to recent history, this strategy materially protected our capital in 2022 when virtually every long only vanilla stock and bond investor got crushed.
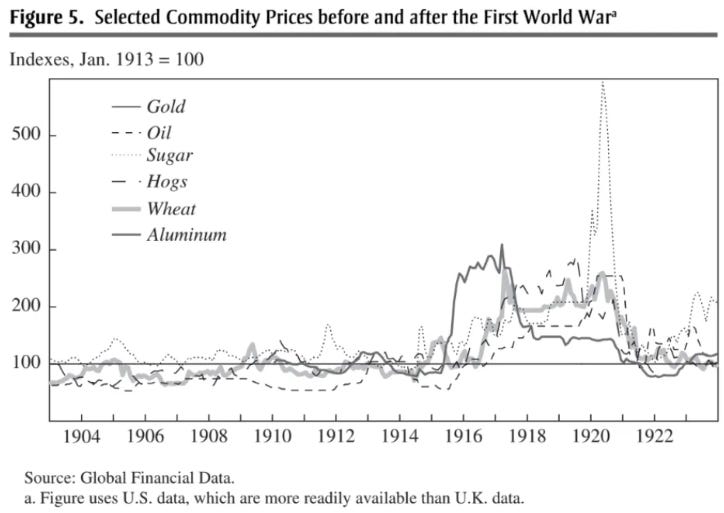
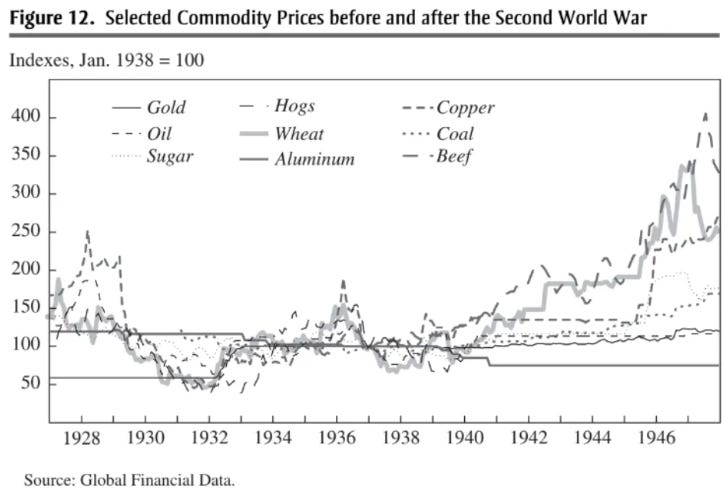
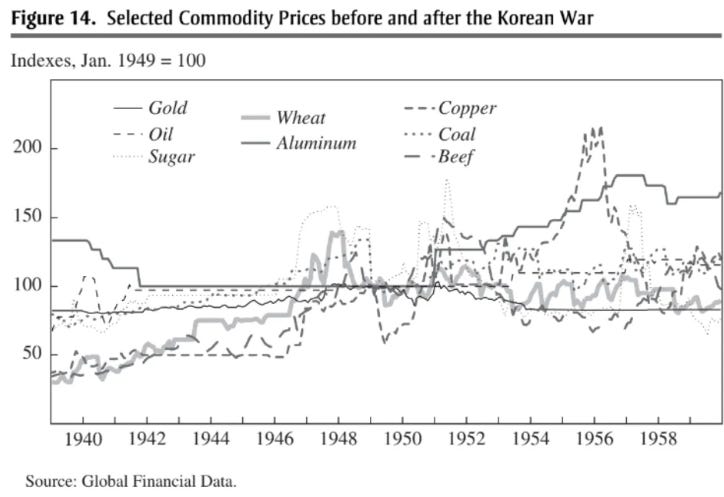
With regards to deep history, there is asymmetric value in these strategies at an ultra low starting point of armament spending which leads to
Failed deterrence and then
A resurgence in armament spending which disrupts bond markets and then
Kinetic conflict which disrupts commodity markets
This is a pattern we identified in our aforementioned deep dive into global armaments.
Moreover, the beauty of this investment style is the ruthless execution of its quantitive rules which means there is no psychological barriers to changing one’s mind and thus positions when the data says the world is changing.
In fact, the long term evidence of this strategy’s veracity is the human tendency to under-react to long term real world fundamental change (we tend to assume the recent past will continue into the future).
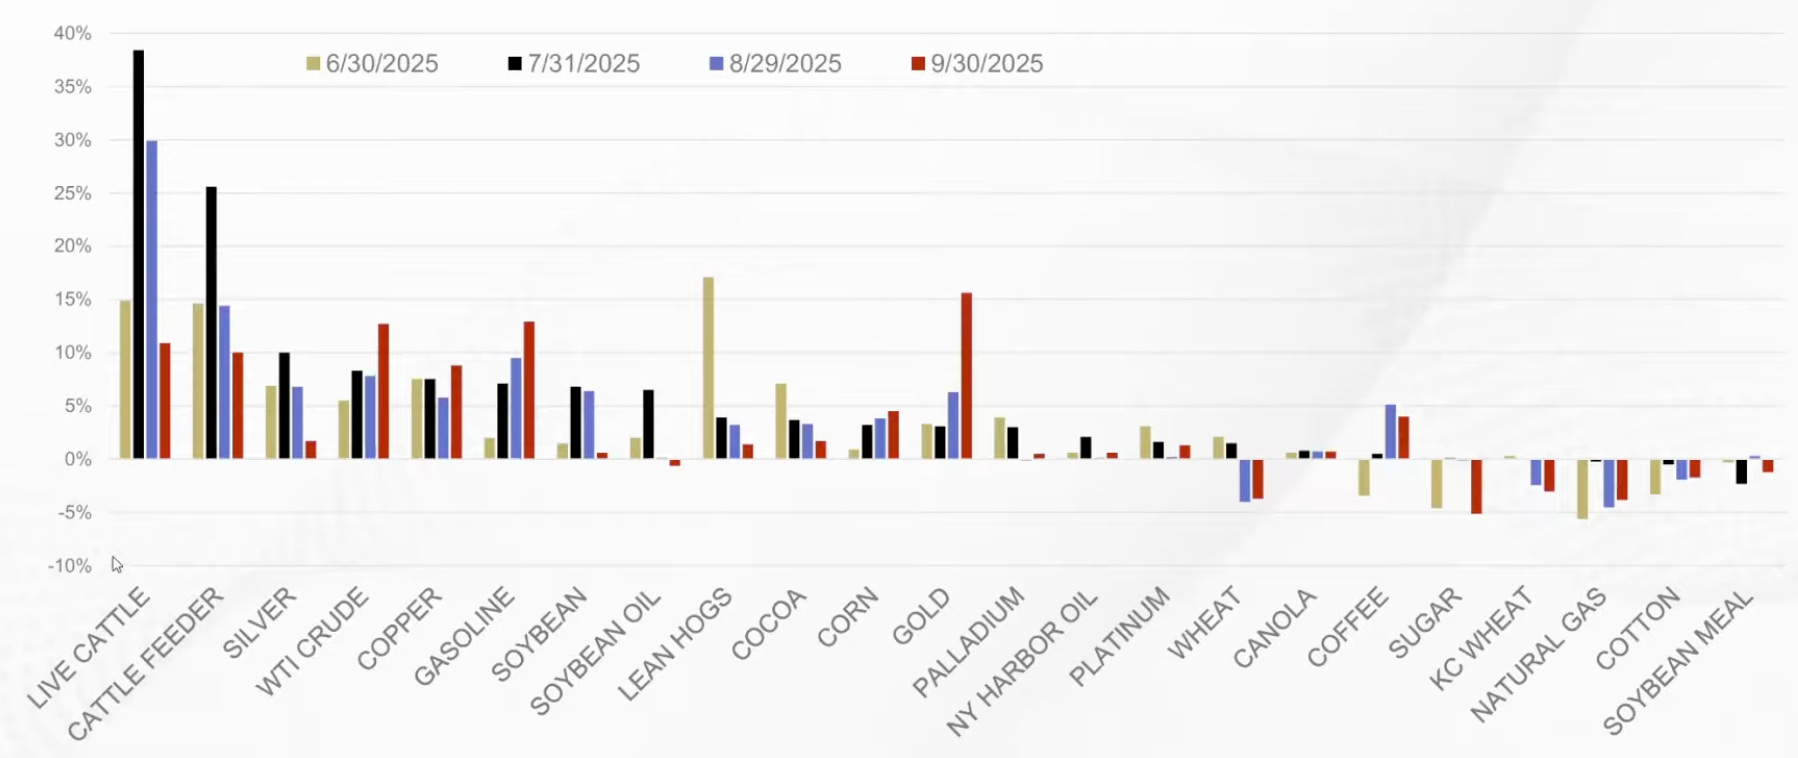
The following chart shows current exposures as well as recent exposures which highlights the adaptive nature of the strategy.
Exposures
Commodity Exposures
Interest Rate Exposures
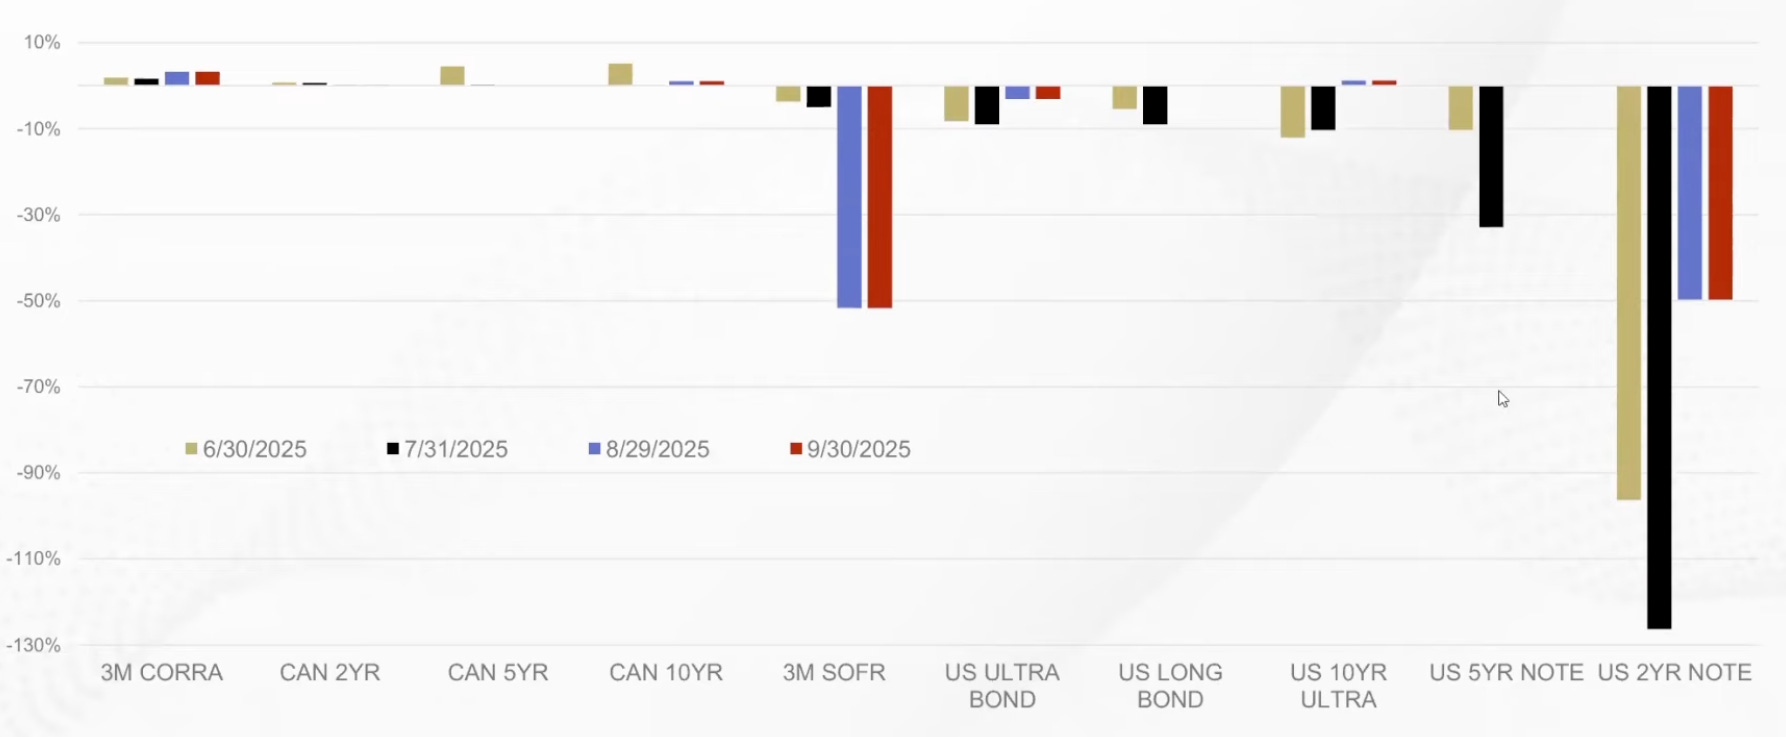
The Performance
For the Quarter
These exposures underperformed the world equity benchmark but outperformed the world bond benchmark.
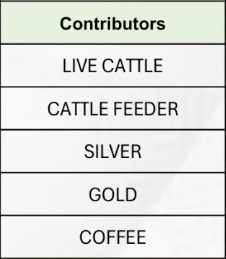
Key Contributors
The positive contributors were the commodities exposures as seen below:
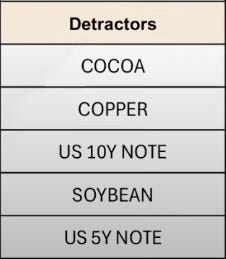
The negative contributors were mostly the interest rate exposures as seen below:
Gresham’s Wrath (Gold Bullion with a Twist)
The Summary
Gold is a chemical element that has historically been the premier form of commodity money because of its unique physical properties.
It is chemically stable and virtually indestructible, meaning almost all the gold ever mined is still in existence. This durability, combined with its geological rarity, gives gold the highest stock-to-flow ratio of any physical commodity, with new annual production consistently adding only about 1.5% to the existing supply.
This reliable scarcity makes gold a superior store of value, as its supply cannot be easily increased even when its price rises, thus protecting it from the debasement that has plagued other forms of money throughout history.
For a deeper dive into why we allocate to gold checkout the post below:

The Exposure
This exposure is one that we helped create and was inspired by our work in applied history which we define as a practical tool that uses the laboratory of the past to better understand and navigate the complexities of the present and future.
We observed that Gresham’s Law states “bad money drives out good money” i.e. people rapidly spend the less valuable money and hoard the most valuable money.
For example, you spend in credit ledger money for consumption needs (like food) but save in commodity ledger money for savings needs (like gold).
We also considered a common criticism from fiat enthusiasts that gold does not provide a yield or income and is therefore less valuable.
Despite this not being the fatal defect that fiat enthusiasts think it is, we nevertheless considered this observation.
We ultimately merged these two observations into an exposure that we call “Gresham’s Wrath”.
It is a magnified gold exposure that also generates income.
Specifically, it is the combination of two different strategies:
First, we get 1.5X exposure to the price of gold. For example, if the gold price goes up 10% then this exposure would likely be up 15%. Effectively, it buys $10 of gold with cash and then borrows the remaining $5 to buy the remaining gold position which results in a total gold exposure of $15. As institutional investors in global capital markets, we are able to borrow at an interest rate in the low single digits. Thus, we are effectively borrowing a debasing credit ledger money whose interest costs are in the low single digits to buy a debasement resistant commodity ledger monetary reserve asset.
Second, we layer on the selling of put spreads to generate option income. This is akin to selling a fire insurance policy that lasts for 2 weeks before it expires for a price of $10 and then buying firestorm reinsurance for $1 thus pocketing $9 for the two week period. By renewing this “fire insurance policy” every two weeks we expect over the long term to generate a modest amount of additional income in a very prudent manner.
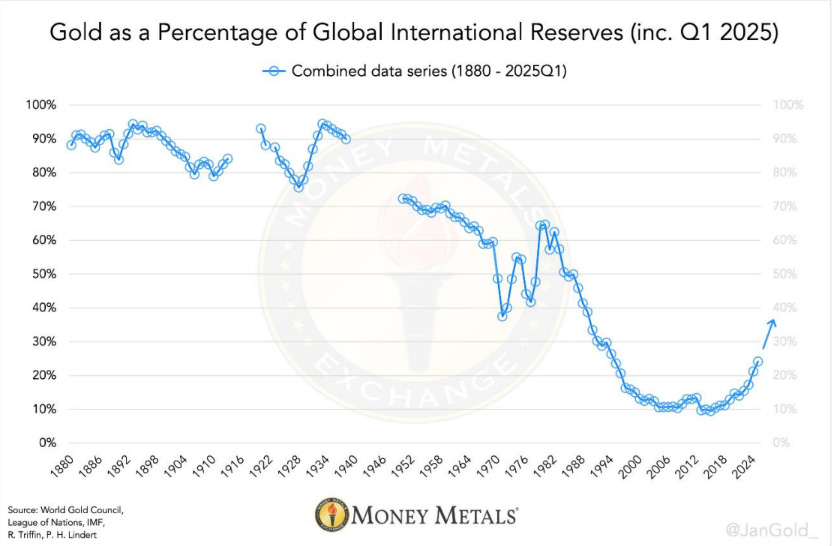
Finally, at the 50,000 ft altitude of analysis, you will see that
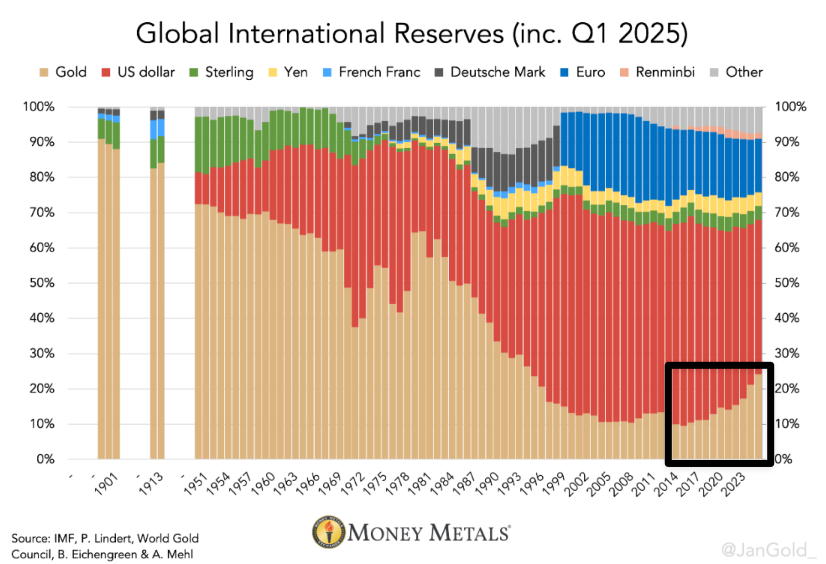
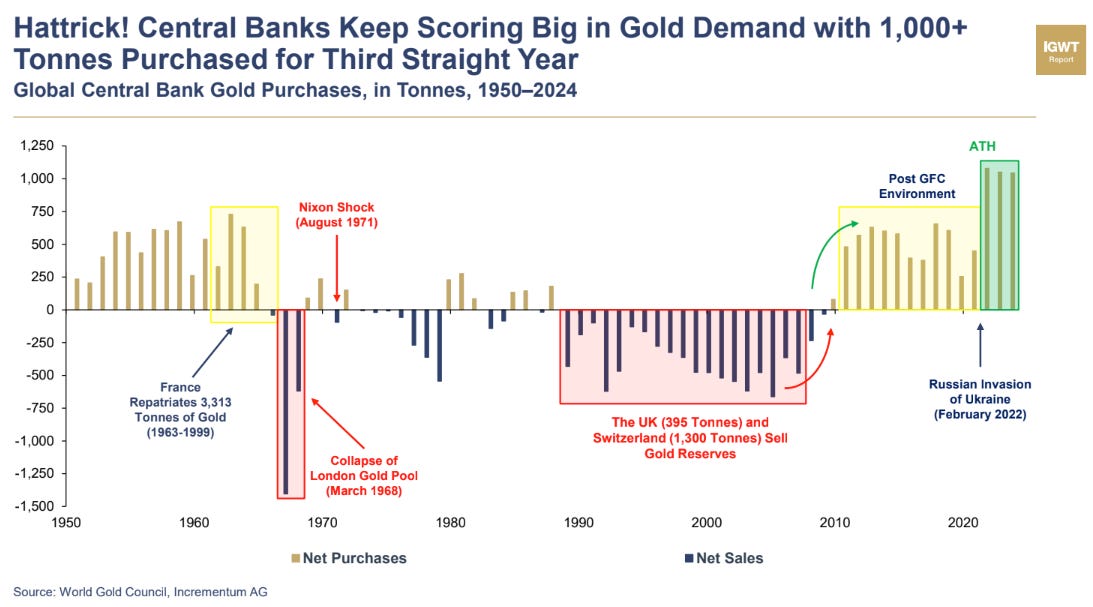
Gold demand from global central banks is accelerating at the same time US Treasuries are being reduced.
Gold demand from global central banks intensely accelerated after the start of Russia’s invasion of Ukraine.
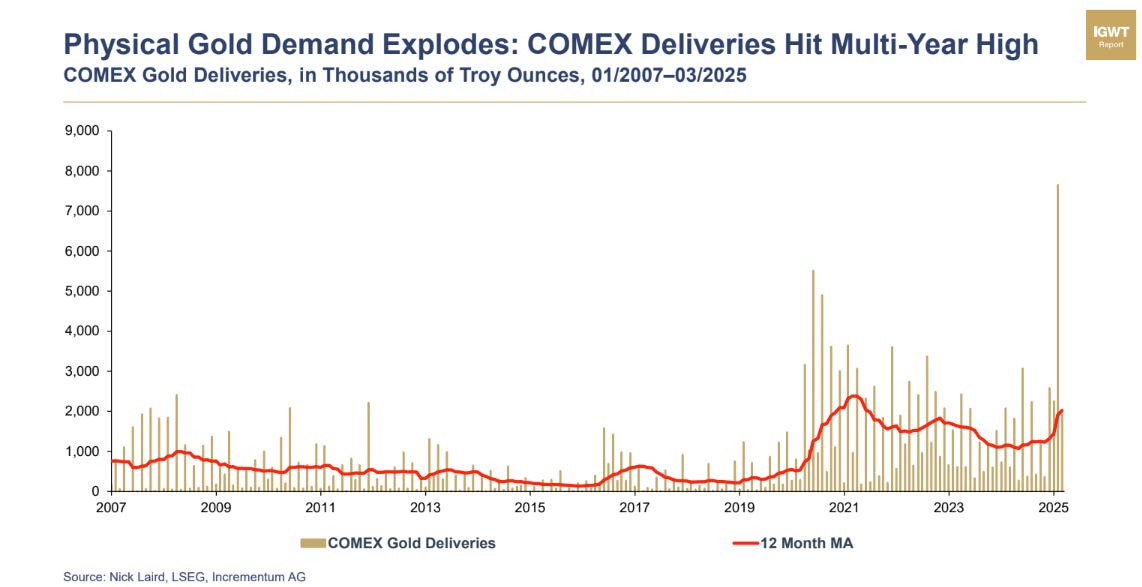
Gold exposure is being specifically expressed via physical deliveries which highlights growing mistrust.
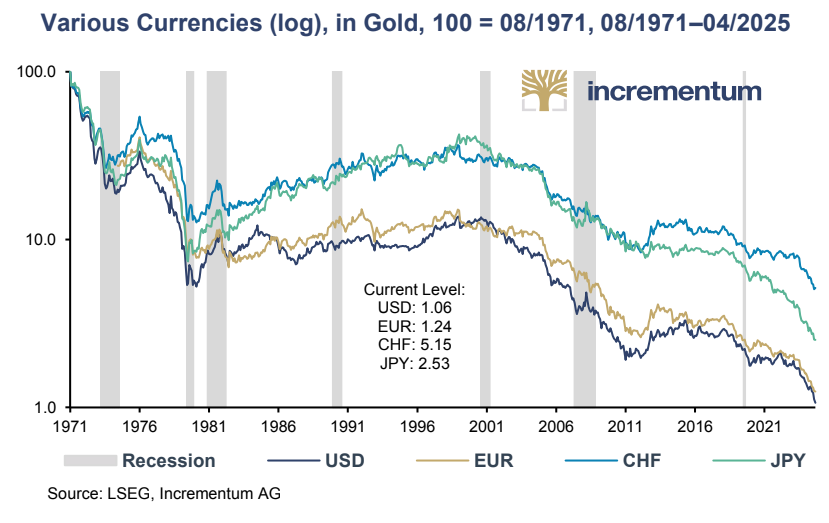
The top global fiat currencies (USD, EUR, GBP, CHF, JPY, etc) have all lost material value relative to gold once they were severed from the gold link in 1971. In fact, the best performing fiat of the Swiss Franc (CHF) “only” lost 93% of its value.
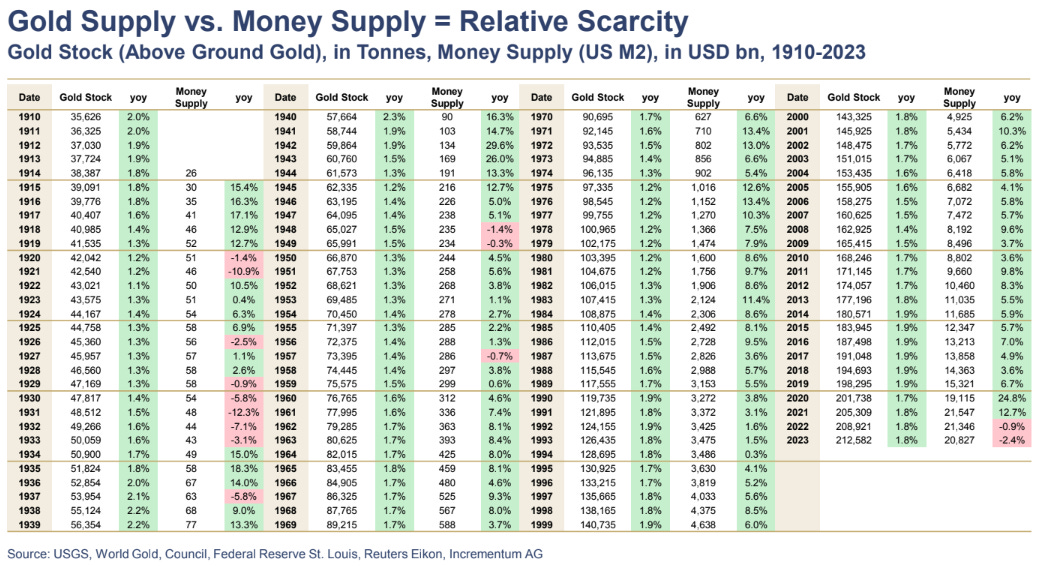
Over the past 109 years, the gold supply has increased from 38,387 tones in 1914 to 212,582 tonnes in 2023 which is an annualized increase of 1.59% per year which favorably compares to the USD supply of 26 billion in 1914 to 212,582 billion in 2023 which is an annualized increase of 8.61%. Thus, the real rate of annualized USD Fiat debasement is closer to the high single digits as opposed to the low single digits so commonly cited by fiat enthusiasts.
The Performance
For the Quarter
This position materially outperformed the world equity benchmark and materially outperformed the global bond benchmark.
Disclaimer
This website is not an offer or solicitation in any jurisdiction in which the firm is not registered. Information presented is for educational purposes only. It should not be considered specific investment advice, does not take into consideration your specific situation, and does not intend to make an offer or solicitation for the sale or purchase of any securities or investment strategies. The services, securities and financial instruments described on this website may not be suitable for you, and not all strategies are appropriate at all times. Investments involve risk and are not guaranteed. Past performance is not necessarily a guide to future performance. Independent advice should be sought in all cases.
TYME Advisors is a U.S. Securities and Exchange Commission (SEC) Registered Investment Advisor . Registration does not imply a certain level of skill or training. Information about the firm including the Customer Relationship Summary is available on the SEC’s website at www.adviserinfo.sec.gov. Information about our privacy policy is located here.