Q1 2026 Portfolio Commentary
A Long/Short Longboat Update


This commentary is based upon client portfolio performance reports.
It is intended as supplementary material to those reports.
You can access your client portal which includes these reports here:
Investing is a means to an end and is step 3 in our financial planning process.
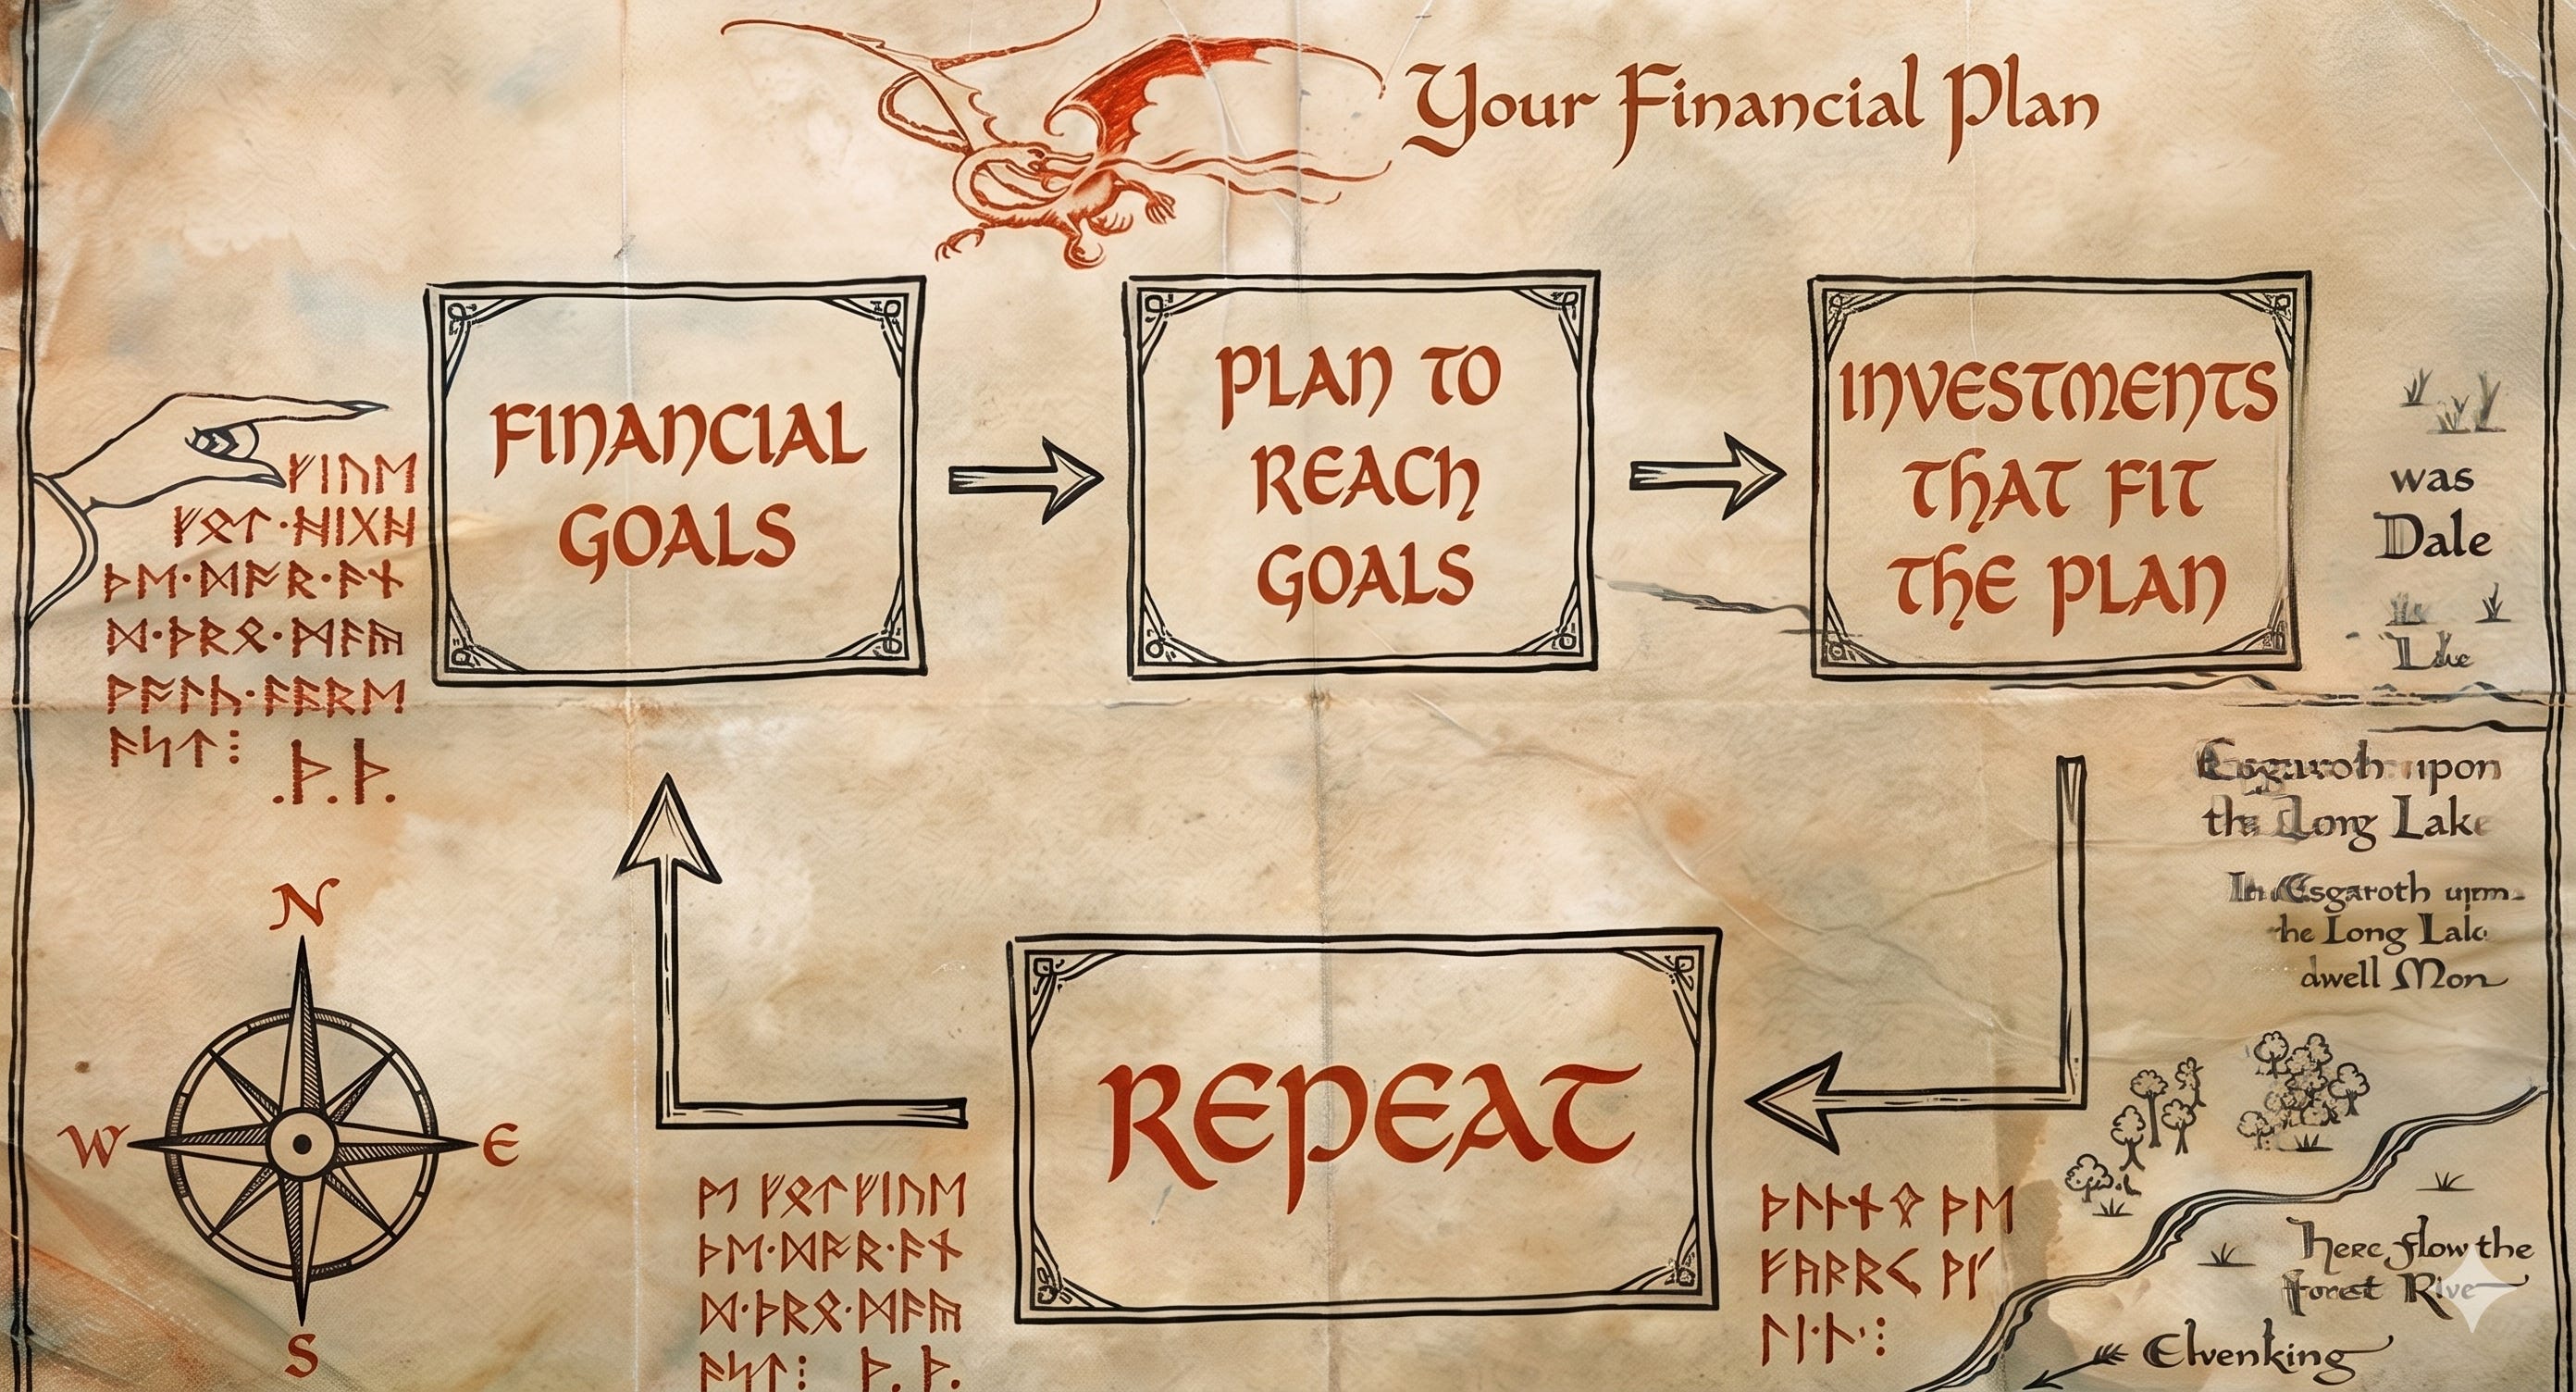
That end is accomplishing your financial goals per your custom financial plan.

Every financial plan has an implied required return (RR) that must be earned over the long term for the portfolio to do its part in making a financial plan robust.
Furthermore, the following is a good expectations cleanser.
It shows the top 5%, bottom 5%, and the average annual return for various global stock/global bond allocations looking back 120+ years (1901–2022).
It illustrates the historical range of possibility (extreme good annual return, extreme bad annual return, and average annual return) by different portfolio types from the least risky allocation (100% bonds on the left) to the most risky (100% stocks on the right).
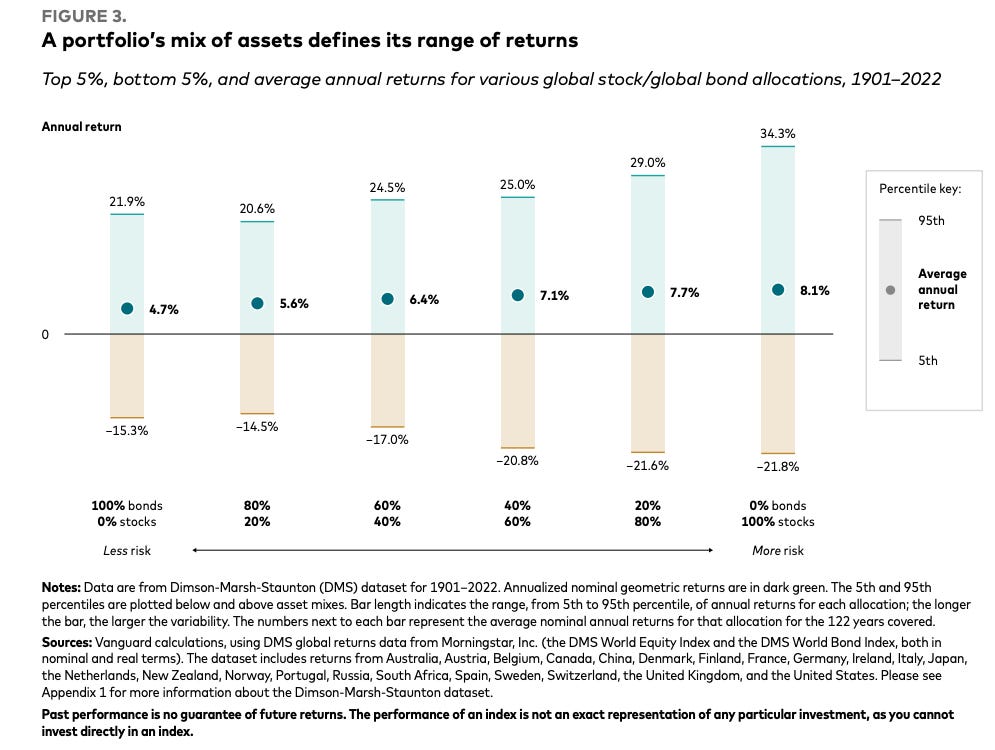
With that said, let us compare how the managed portfolios have performed relative to their respective RR and to their respective comparable low cost publicly traded diversified portfolio benchmarks.

Aggressive Portfolios
Relative to the Required Return (RR)
For the Quarter
They materially outperformed.
For the Year to Date
They materially outperformed.
Relative to Comparable Portfolio Benchmarks
For the Quarter
They materially outperformed.
For the Year to Date
They materially outperformed.
Balanced Portfolios
Relative to the Required Return (RR)
For the Quarter
They materially outperformed.
For the Year to Date
They materially outperformed.
Relative to Comparable Portfolio Benchmarks
For the Quarter
They materially outperformed.
For the Year to Date
They materially outperformed.
Cash Reserve Portfolios
Relative to Comparable Portfolio Benchmarks
For the Quarter
They performed in line.
For the Year to Date
They performed in line.
The Equity Sleeve
Relative to the World Equity Benchmark
For the Quarter
It materially outperformed.
For the Year to Date
It materially outperformed.
The Attribution
For the Quarter
Key Contributors (added value)
Global Armaments
West Texas Real Estate + Mineral Rights
Japan (Dynamic Currency Hedging)
Key Detractors (subtracted value)
High Quality US Large Companies
Semiconductors
South Korea
For the Year to Date
Key Contributors (added value)
Global Armaments
West Texas Real Estate + Mineral Rights
Japan (Dynamic Currency Hedging)
Key Detractors (subtracted value)
High Quality US Large Companies
Semiconductors
South Korea
Exited Positions
Bitcoin
Despite our long term bullish views on it, we still incorporate a quantitative risk management process akin to how commodity trading funds (CTAs) risk manage their long and short positions across equities, currencies, bonds, and commodities.
We began adding back the position in January after fully exiting between October 2025 and November 2025 (thus avoiding a double digit drawdown).
Shortly thereafter our system began to flash a bright red warning so we again exited the position at a low single digit loss (thus avoiding another significant double digit drawdown).
It is very likely we will add back exposure once our system indicates favorable conditions are in place.
For our long term views on this exposure, checkout this post.

Japan (Dynamic Currency Hedging)

This exposure starts with a universe of 1,300+ Japanese companies and filters out companies that treat shareholders poorly based upon shareholder yield and corporate governance screens.
The final portfolio is less than 200 companies that statistically treat shareholders better than the unfiltered index.
The next step is to determine the degree of currency hedging.
As a US investor, when one buys a Japanese stock you are impacted by both the Japanese stock in its own currency (Yen) in addition to the currency performance of USD relative to Yen.
Total Return = Local Stock Return + Currency Return
Our desired exposure is the Japanese companies themselves and thus we want to hedge the currency risk.
This position dynamically updates its currency hedge (0% hedge means full exposure to Yen and 100% hedge means 0% exposure to Yen) based on a four separate currency submodels to determine what the hedge ratio should be.
Despite our long term bullish views on this asset and even though it was a major contributor to our outperformance for the quarter, we exited this position as the “Quantamentals” began to materially degrade in no small part from the flashpoint that is Gulf War 3.
After all, Japan imports a majority of its energy and a majority of that energy comes from the Middle East and as of this writing we are still experiencing one of the largest energy shocks in history.
Over the past few hundred years in the US and the UK, energy shocks have been responsible for roughly 50% of recessions.
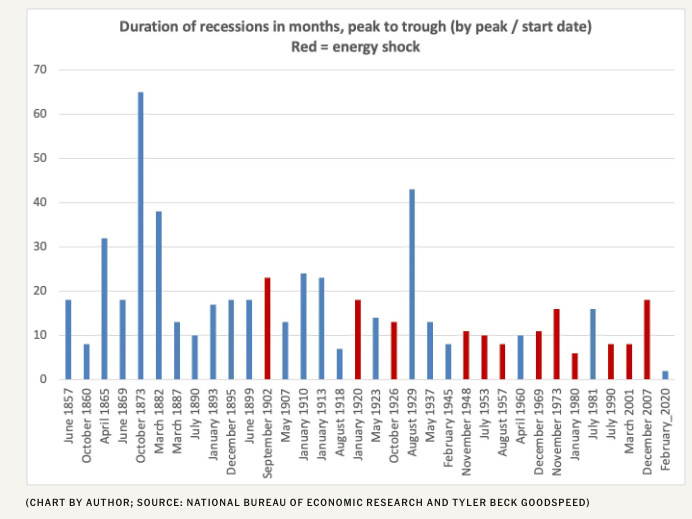
It is very likely we will add back exposure once the Quantamentals indicate favorable conditions are in place.
For our long term views on this asset, checkout this post.

Capital Markets Exchanges
Despite our long term bullish views on these assets, we exited them as we decided to delegate more of the specific equity selection to discrete managers whose process we find highly compelling.
South Korea

This was an exposure that prior to the start of Gulf War 3 had great Quantamental signal strength. We began building the position literally the day before the start of Gulf War 3.
Fate it seemed had other plans.
Within just a week or so the Quantamentals for South Korea materially degraded to the point that we exited the position.
Hope is not a strategy and it is better to realize a small loss before it becomes a bigger loss.
Mr. Market does not care about your cost basis.
South Korea, like Japan, imports a majority of its energy and a majority of that energy comes from the Middle East and as of this writing we are still experiencing one of the largest energy shocks in history.
High Quality US Small Companies
This exposure consists of US Small Companies and then seeks to earn superior long term returns with lower downside risk by filtering out junk companies (overvalued and low quality companies run by poor management teams).
It filters out these factors which are a concentrated source of downside risk:
High External Financing: companies that are over reliant on external capital through high debt or stock sales (i.e. a farmer who keeps selling his land to buy seeds for planting crops).
Wealth Destroyers: companies that reinvest cash flow but generate economic returns below their cost of capital (i.e. borrow at 8% to earn 2% which destroys 6%).
Value Traps: companies where intrinsic value is lower than book value (i.e. a home that seems cheap on a price per square foot basis but it has a cracked foundation, rotted support beams, etc).
This too was an exposure we were building before the start of Gulf War 3.
Within weeks the Quantamentals for US Small Companies materially degraded to the point that we exited the position.
Generally, small companies do relatively poorly in the macro weather pattern of fall i.e. accelerating inflation rates and decelerating growth rates.
It is this fall weather pattern that is becoming more likely which is a direct result of this energy shock. This is also very consistent with history.
We think highly of this manager and very much buy into its process for filtering out junk companies in the US Small Companies universe and will add back to the exposure once the Quantamentals shift in our favor.
Semiconductors

This was an exposure that prior to the start of Gulf War 3 had great Quantamental signal strength.
Within just a week or so the Quantamentals for Semiconductors materially degraded to the point that we exited the position.
Semiconductor manufacturing, like South Korea and Japan, imports a majority of its critical energy related inputs (natural gas, helium, etc) from the Middle East and as of this writing we are still experiencing one of the largest energy shocks in history.
Samsung and SK Hynix (large memory/semiconductor manufactures) hold a few months of helium which means if no new supply comes in they will run out in April or May.
That is roughly the same window when the stranded containers in the Persian Gulf start venting.
Helium is chilled to a liquid state and put on insulated ships. If they do not offload this in time the containers warm up and then the helium turns back into a gas and vents into space.
EUV lithography needs 99.9999% purity helium for wafer cooling. No substitute exists. If Korean fabs ration memory production, every NVIDIA GPU delivery slips.
Then AI buildout stalls in those regions on a supply chain input that costs pennies per GPU chip.
H/T to

Maintained Positions
Systematic Long/Short Extensions
This position only applies to those with large taxable account balances.
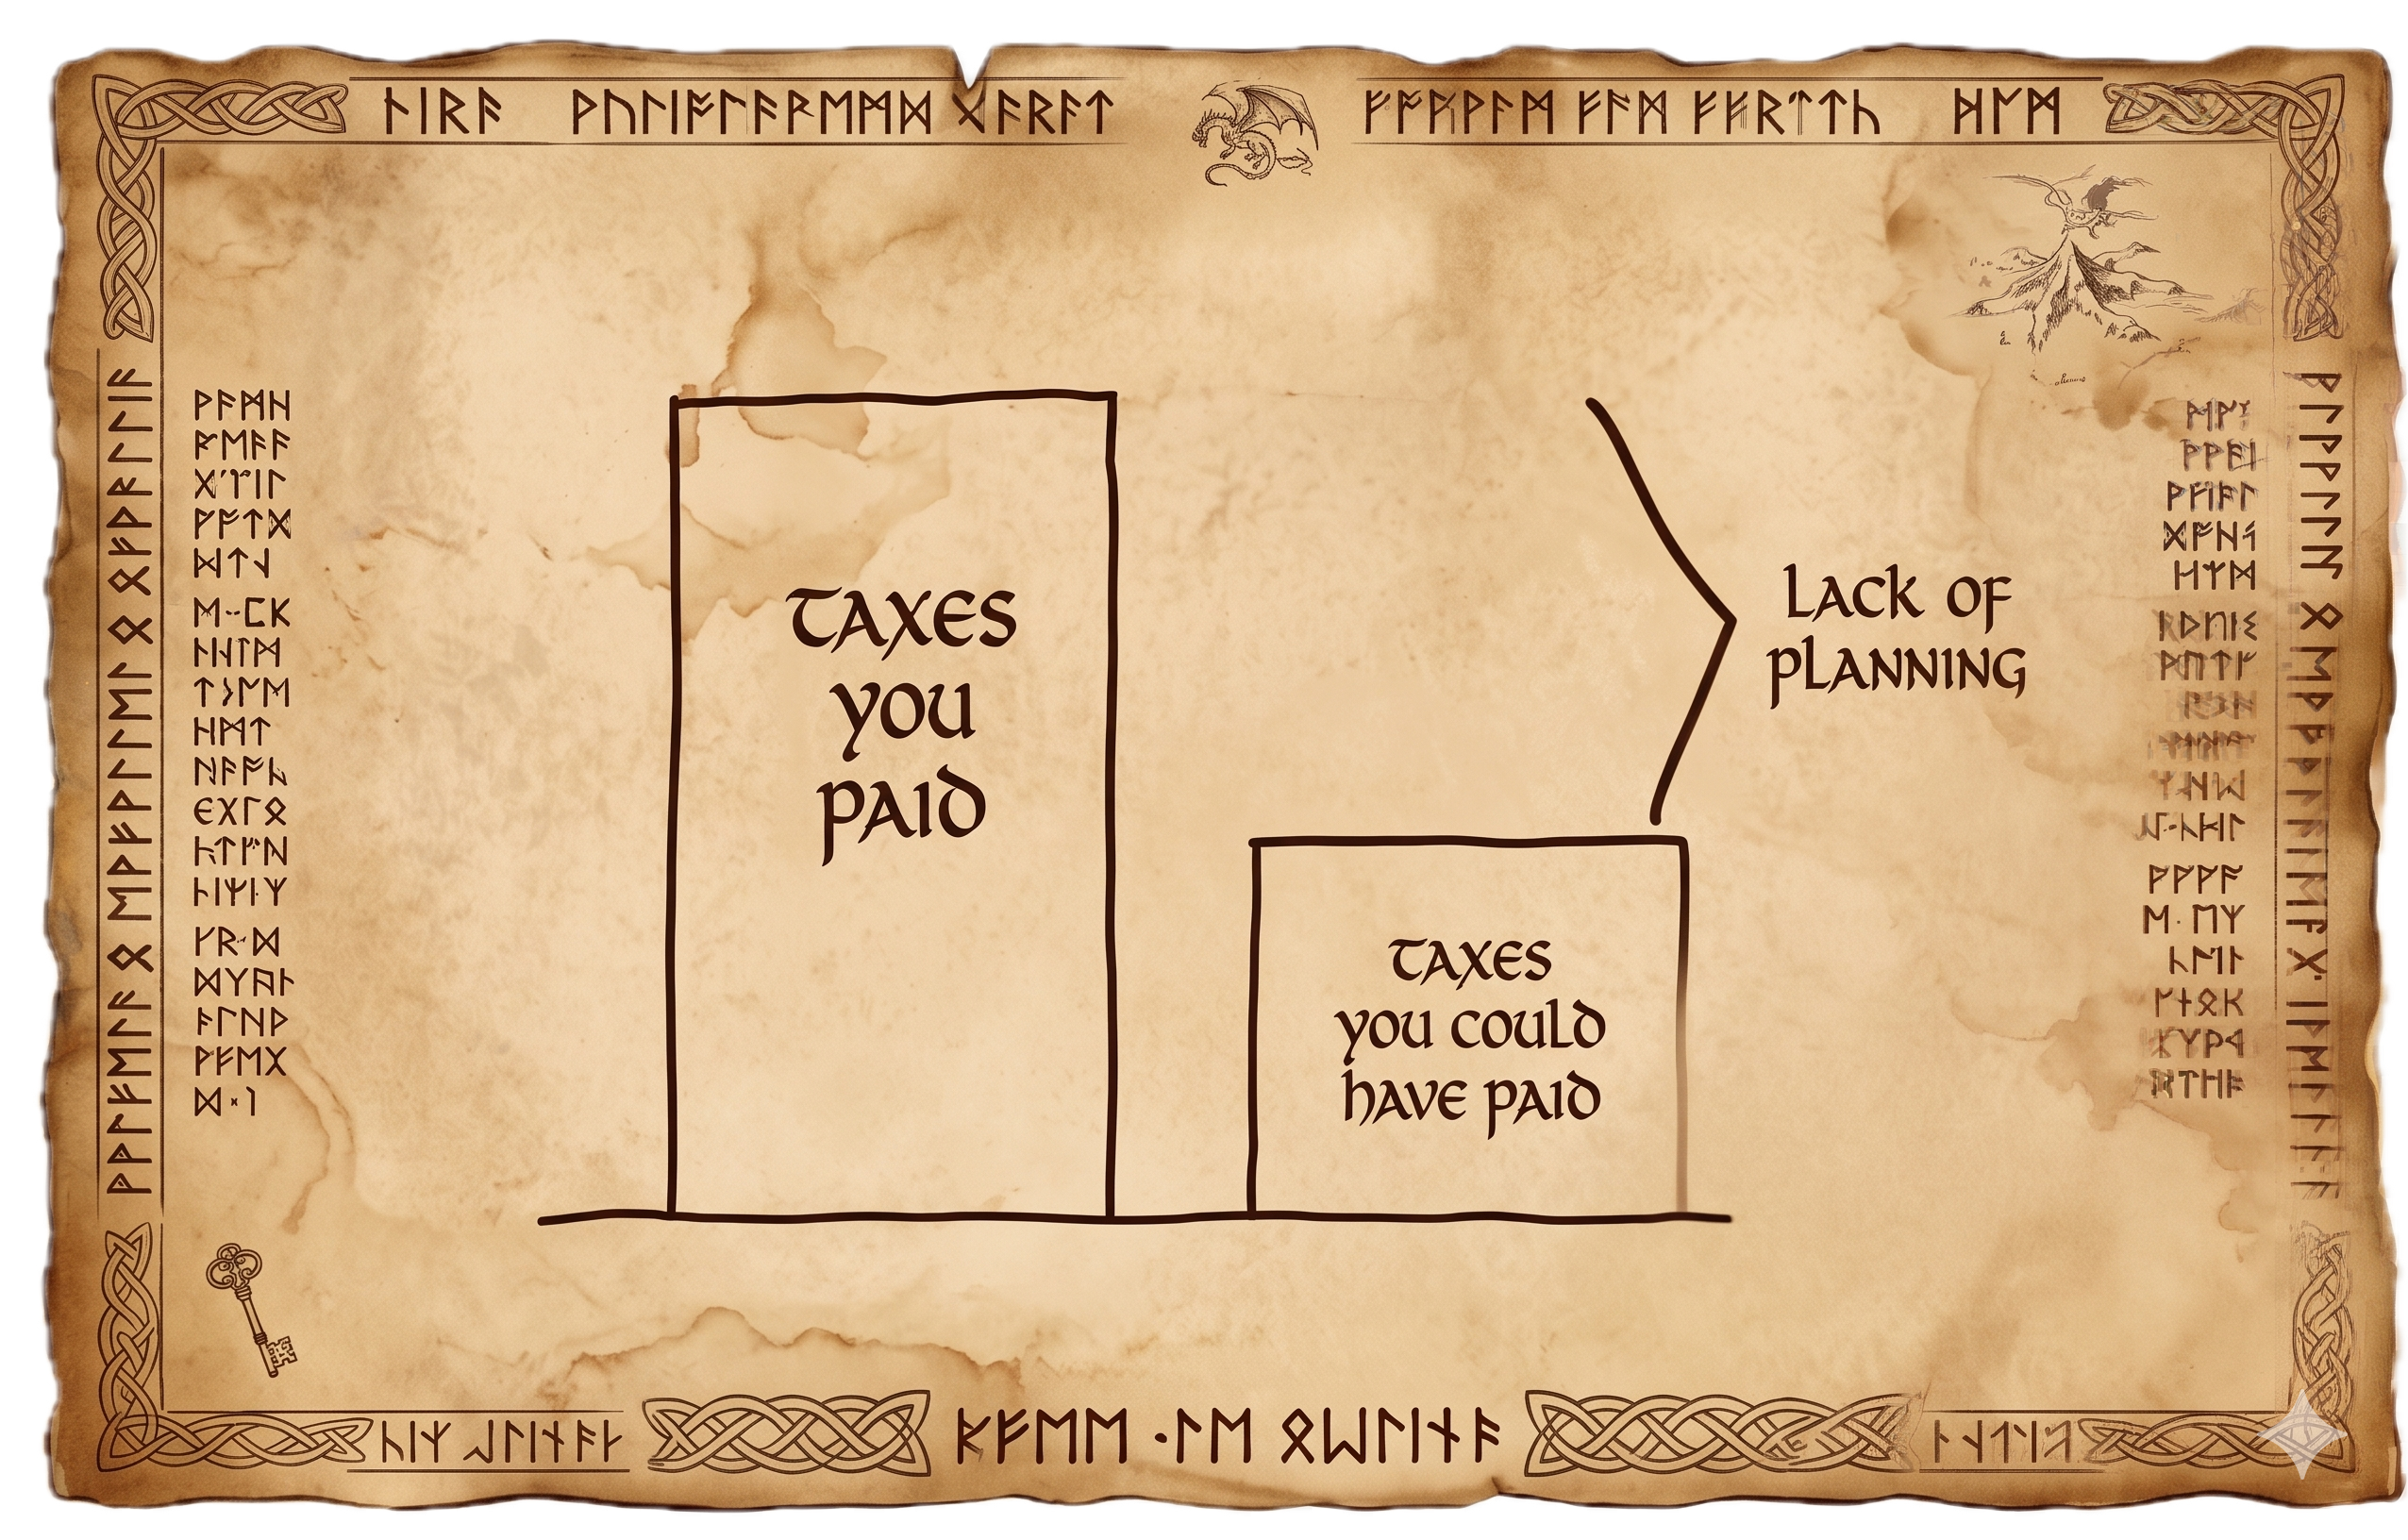
The Summary
This takes tax loss harvesting 1.0 and upgrades it to tax loss harvesting 2.0.
It improves after-tax wealth compounding within a risk-managed framework and has several practical uses, including diversifying concentrated stocks, revitalizing “frozen” taxable accounts with large unrealized capital gains, and building up capital losses to offset future capital gains and thus lower one’s tax burden.
For a deeper dive, checkout the post below:

This is one of our many tools that we use in tax planning for clients.
They were in line with its benchmarks and also reduced concentrated positions with significant embedded gains and yet only realized net short term losses.
These net short term realized losses were both a blend of closing out short positions and closing out long positions which makes sense given equities were choppy for the quarter.
Going long means making money when prices rise.
This is buying low then selling high.
Going short means making money when prices fall.
This is selling high then buying low.
High Quality US Large Companies
The Summary
This exposure consists of US Large Companies and then seeks to earn superior long term returns with lower downside risk by filtering out junk companies (overvalued and low quality companies run by poor management teams).
It filters out these factors which are a concentrated source of downside risk:
High External Financing: companies that are over reliant on external capital through high debt or stock sales (i.e. a farmer who keeps selling his land to buy seeds for planting crops).
Wealth Destroyers: companies that reinvest cash flow but generate economic returns below their cost of capital (i.e. borrow at 8% to earn 2% which destroys 6%).
Value Traps: companies where intrinsic value is lower than book value (i.e. a home that seems cheap on a price per square foot basis but it has a cracked foundation, rotted support beams, etc).
The Performance
Relative to the World Equity Benchmark
For the Quarter
It underperformed.
Key Contributors (subtracted value)
Microsoft
Alphabet
Apple
For the Year to Date
It underperformed.
Key Contributors (subtracted value)
Microsoft
Alphabet
Apple
Global Armaments

The Summary
This exposure focuses on companies that make armaments for nation state security.
To summarize our extensive research on this topic which we have previously written about: the entire world is rapidly rearming off an extremely low base of defense spending.
For our deep dive into this topic, checkout this post:

The Performance
Relative to the World Equity Benchmark
For the Quarter
It materially outperformed.
Key Contributors (added value)
Lockheed Martin (US Armaments)
Elbit Systems (Israel Armaments)
BAE Systems (British Armaments)
For the Year to Date
It materially outperformed.
Key Contributors (added value)
Lockheed Martin (US Armaments)
Elbit Systems (Israel Armaments)
BAE Systems (British Armaments)
Precious Metal Royalty/Streaming Companies

The Summary
This provides us with a diversified exposure to precious metals (gold and silver) by benefiting from both price appreciation of the metals and the production growth of the mines without the operational risks of mining.
Additionally, these exposures typically do well when traditional exposures do not and thus provides potent equity portfolio diversification.
For our deep dive into this topic, checkout this post:

The Performance
Relative to the World Equity Benchmark
For the Quarter
It materially outperformed.
Key Contributors (added value)
Wheaton Precious Metals
Franco Nevada
For the Year to Date
It materially outperformed.
Key Contributors (added value)
Wheaton Precious Metals
Franco Nevada
West Texas Real Estate + Mineral Rights

The Summary
This is West Texas Real Estate along with the associated oil, gas, and water rights.
Vast, Perpetual Land Holdings: It is one of the largest private landowners in Texas, with approximately 870,000 acres of surface estate and 2.4 million acres of mineral interests, primarily in the Permian Basin. Additionally, this exposure is located in District 8 which is responsible for about 20% of all oil and gas production in the U.S. This land is a finite, irreplaceable asset that cannot be replicated.
High-Margin Royalty Income: It owns perpetual oil and gas royalty interests on hundreds of thousands of acres. This generates high-margin revenue from energy production without the associated capital expenditures or operating risks of exploration and production companies.
Capital-Light Compounding Machine: The business model requires minimal capital investment to generate revenue, leading to extremely high free cash flow. This cash can be used for dividends, share buybacks, and acquiring more royalty assets, creating a powerful compounding effect over time.
Zero Debt: It has a pristine balance sheet with no debt, making it incredibly resilient through all economic cycles.
Multi-Faceted Revenue Streams: Beyond oil and gas, it generates revenue from surface leases, easements for pipelines, water sales, and other commercial activities, providing diverse and growing income streams.
Hard Asset Focus: This is a pure-play land and resource company. Its value is tied directly to tangible, finite assets rather than intellectual property or manufacturing processes.
Inflation Beneficiaries: Its revenues from royalties and leases are intrinsically linked to commodity prices and economic activity, making them excellent hedges against monetary inflation.
Capital-Light Business Model: It primarily leases its assets to others and collects high-margin fees and royalties, avoiding the heavy capital costs and operational risks of its tenants (e.g., oil drillers, data center operators, bitcoin miners, etc).
Permian Basin Location: Its strategically centered in the Permian Basin, the most prolific and economically viable oil and gas producing region in North America.
The Performance
Relative to the World Equity Benchmark
For the Quarter
It materially outperformed.
Key Contributors (added value)
Texas Pacific Land Corp
For the Year to Date
It materially outperformed.
Key Contributors (added value)
Texas Pacific Land Corp
New Positions
US Energy Sector

The Summary
This exposure consists of companies in the oil, gas and consumable fuel, energy equipment and services industries.
Unsurprisingly, the Quantamentals for this exposure materially improved with the start of Gulf War 3.
We view this as an exposure to rent while Quantamentals remain in a positive state.
US MLP and Energy Infrastructure Sector

The Summary
This exposure consists of companies in the midstream infrastructure space which consists of pipelines and storage facilities that have less sensitivity to energy prices.
Unsurprisingly, the Quantamentals for this exposure materially improved with the start of Gulf War 3.
We view this as an exposure to rent while Quantamentals remain in a positive state.
US Utilities Sector

The Summary
This exposure consists of companies from the electric utilities; water utilities; multi-utilities, independent power and renewable electricity producers; and gas utility industries.
Unsurprisingly, the Quantamentals for this exposure materially improved with the start of Gulf War 3.
We view this as an exposure to rent while Quantamentals remain in a positive state.
US Basic Materials Sector

The Summary
This exposure consists of companies in the chemical; metals and mining; paper and forest products; containers and packaging; and construction material industries.
Unsurprisingly, the Quantamentals for this exposure materially improved with the start of Gulf War 3.
We view this as an exposure to rent while Quantamentals remain in a positive state.
The Alternative Sleeve
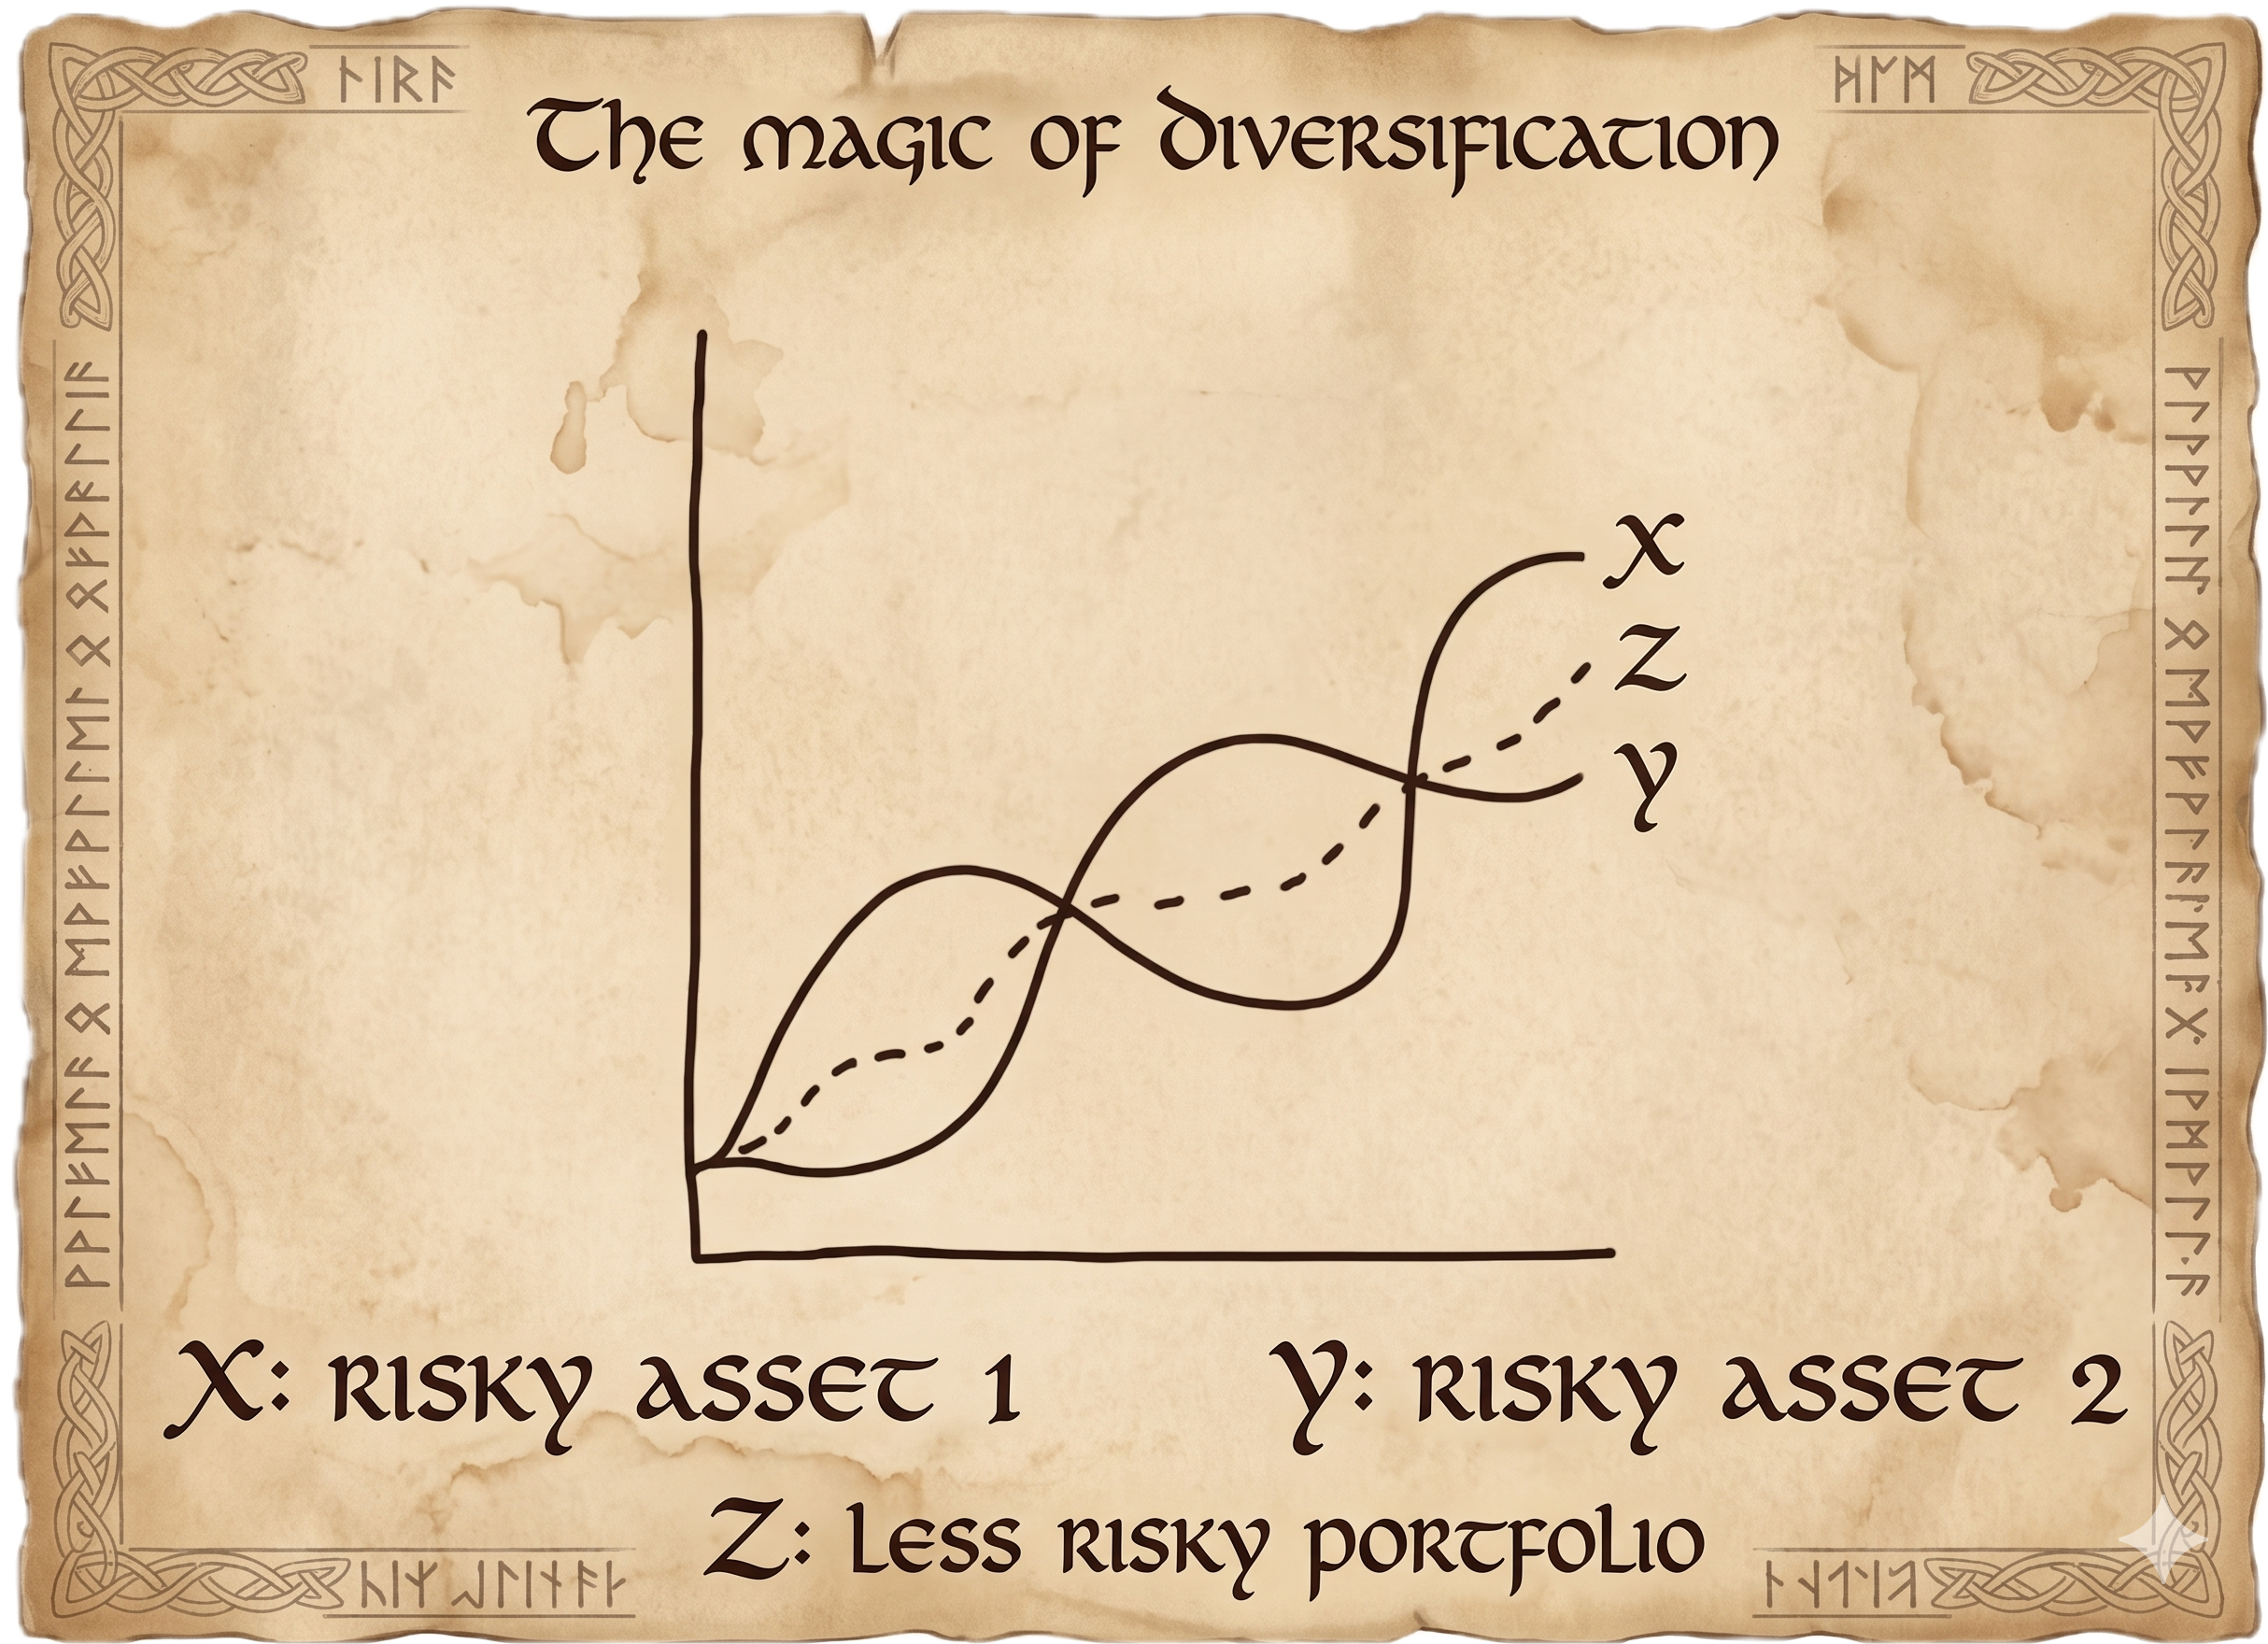
As a reminder, the alternatives we consider are designed to generate returns that are low to negatively correlated to both equities and bonds (they zig when equities/bonds zag).
The Performance
Relative to the World Equity Benchmark
For the Quarter
It materially outperformed.
For the Year to Date
It materially outperformed.
The Attribution
For the Quarter
Key Contributors (added value)
Managed Futures
Gresham’s Wrath (Gold Bullion with Income)
Fully Allocated Physical Gold Bullion
Key Detractors (subtracted value)
None
For the Year to Date
Key Contributors (added value)
Managed Futures
Gresham’s Wrath (Gold Bullion with Income)
Fully Allocated Physical Gold Bullion
Key Detractors (subtracted value)
None
Exited Positions
None
Maintained Positions
Managed Futures

The Summary
This is an exposure designed to generate absolute returns, low correlations to equities (they zig when equities/bonds zag), and help manage downside risk during risk-off events.
Going long means making money when prices rise.
This is buying low then selling high.
Going short means making money when prices fall.
This is selling high then buying low.
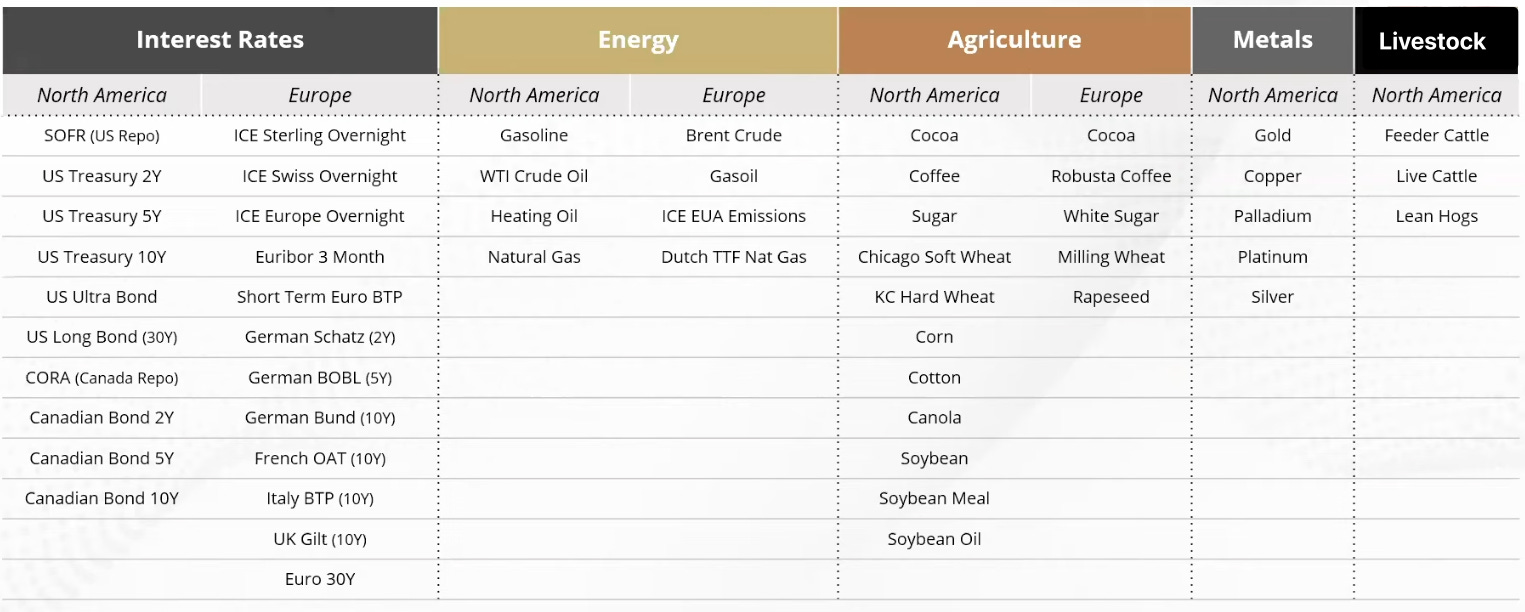
Below represents the different exposures that we can go long or short by asset class, region, and instrument.
As a reminder, this position uses multiple models which are each designed to capture different market dynamics.
Price Trend: aims to perform during periods of disruption, high volatility, and outsized moves in price.
Fundamental Reversion: detects when markets have moved too far from fair value, seeking to deliver returns during periods of lower/falling volatility.
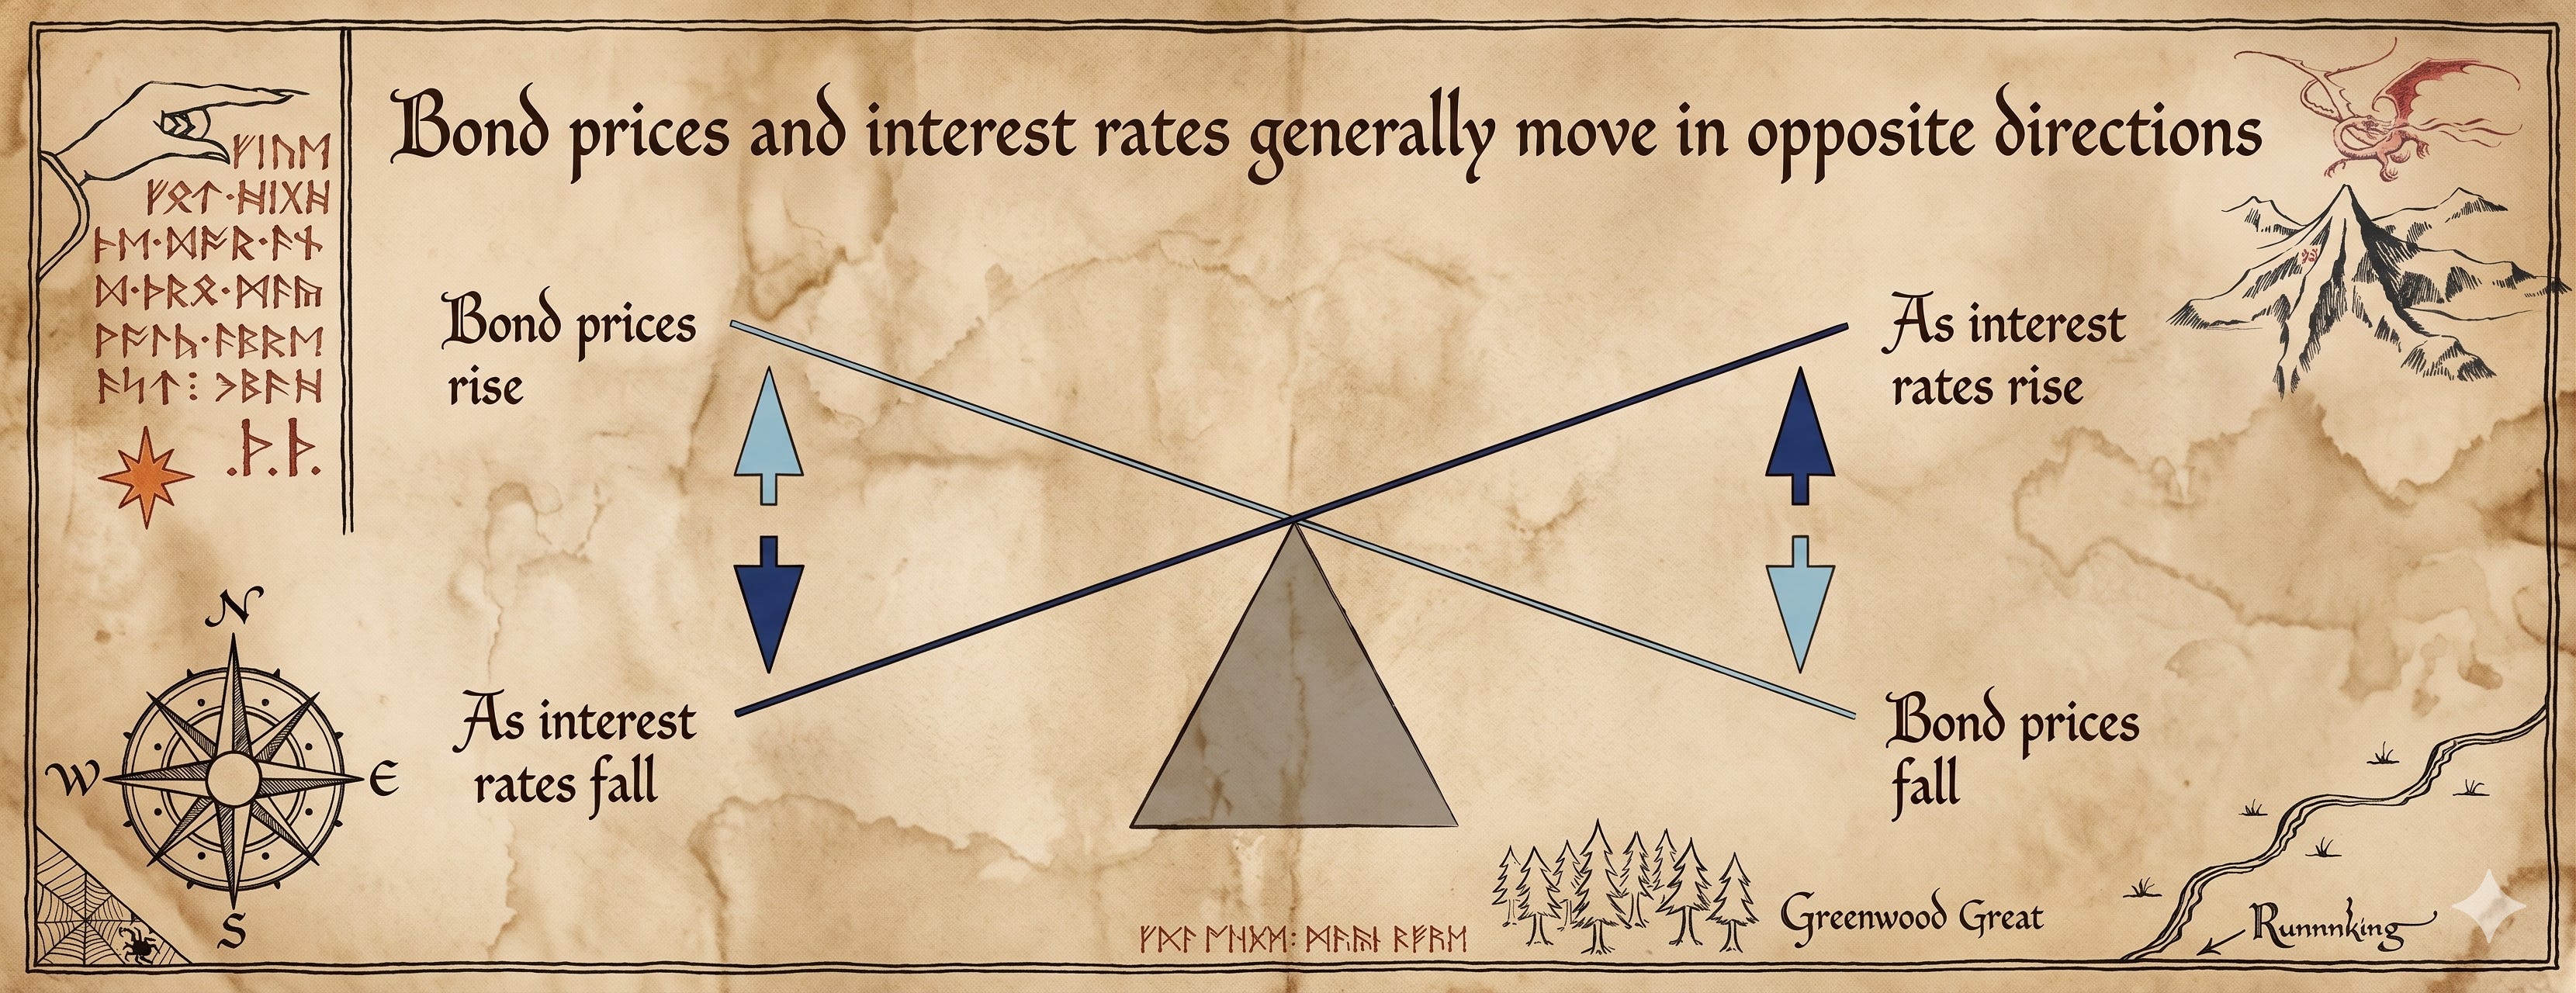
Carry: looks to perform during periods of flat or falling interest rates.
Risk-Off: seeks to capture upward/downward.
With regards to recent history, this type of strategy materially protected our capital in 2022 when virtually every long only vanilla stock and bond investor got crushed.
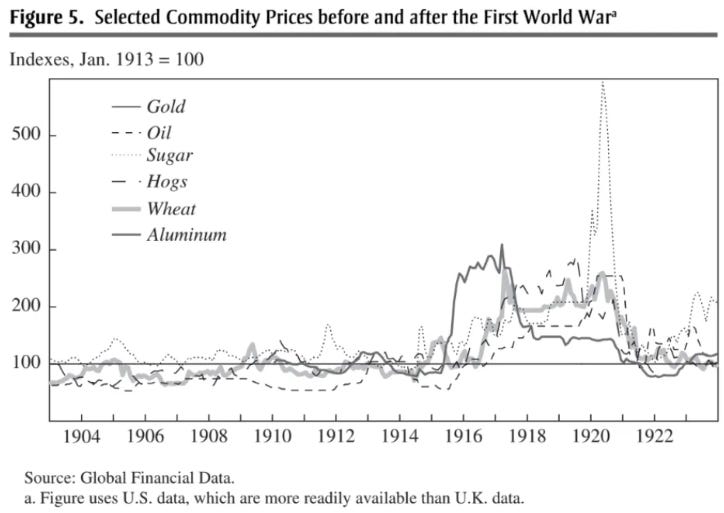
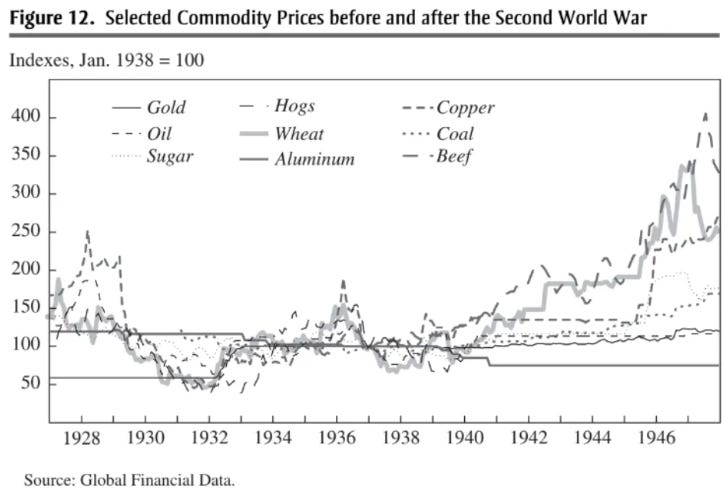
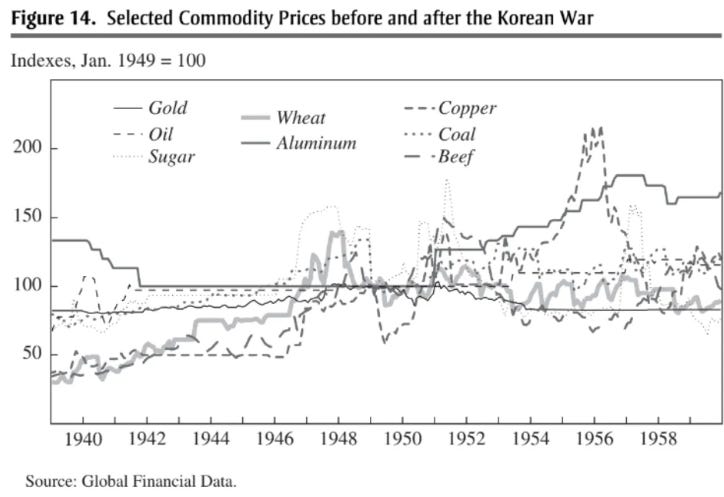
With regards to deep history, there is asymmetric value in these strategies at an ultra low starting point of armament spending which leads to
Failed deterrence and then;
A resurgence in armament spending which disrupts bond markets and then;
Kinetic conflict which disrupts commodity markets.
This is a pattern we identified in our aforementioned deep dive into global armaments:
The current energy shock of Gulf War 3 which is a direct consequence of failed deterrence strikes a familiar tone to those who read history and one of surprise to those who do not.
Gulf War 1
(1990-1991)
Gulf War 2
(2003-2011)
Gulf War 3
(2026-Present)
Moreover, the beauty of this investment style is the ruthless execution of its quantitive rules which means there is no psychological barriers to changing one’s mind and thus positions when the data says the world is changing.
The long term evidence of this strategy’s veracity is the human tendency to under-react to long term real world fundamental change (we tend to assume the recent past will continue into the future).
The Performance
Relative to the World Equity Benchmark
For the Quarter
It outperformed.
Relative to the World Bond Benchmark
For the Quarter
It outperformed.
Key Contributors (added value)
Italy 10 Year Bonds
West Texas Crude Oil
Brent Crude Oil
Gold
Gasoline
Relative to the World Equity Benchmark
For the Year to Date
It outperformed.
Relative to the World Bond Benchmark
For the Year to Date
It outperformed.
Key Contributors (added value)
Italy 10 Year Bonds
West Texas Crude Oil
Brent Crude Oil
Gold
Gasoline
Commentary
March Market Volatility
March was a super wild month driven by Gulf War 3, which caused significant volatility in energy markets.
This oil price shock is causing cost-push inflation, creating a difficult environment for bonds as bond yields rose.
Performance Drivers
While commodity trends performed well during the period, trend-following in interest rates struggled due to counter-trend reversals following the oil shock which was partially cause by investors deleveraging positions in response to the volatility spike.
Broader Market Outlook
The current environment is in an extraordinary moment for the financial system. There is a significant disconnect in the system, as the resolution to the supply shock in commodity markets remains uncertain and that volatility across most asset classes remains elevated compared to historical norms.
System Positioning
From a model perspective, the model is currently observing a broad bull trend in commodities and is positioning the portfolio to capture that momentum.
Gresham’s Wrath (Gold Bullion with Income)
The Summary
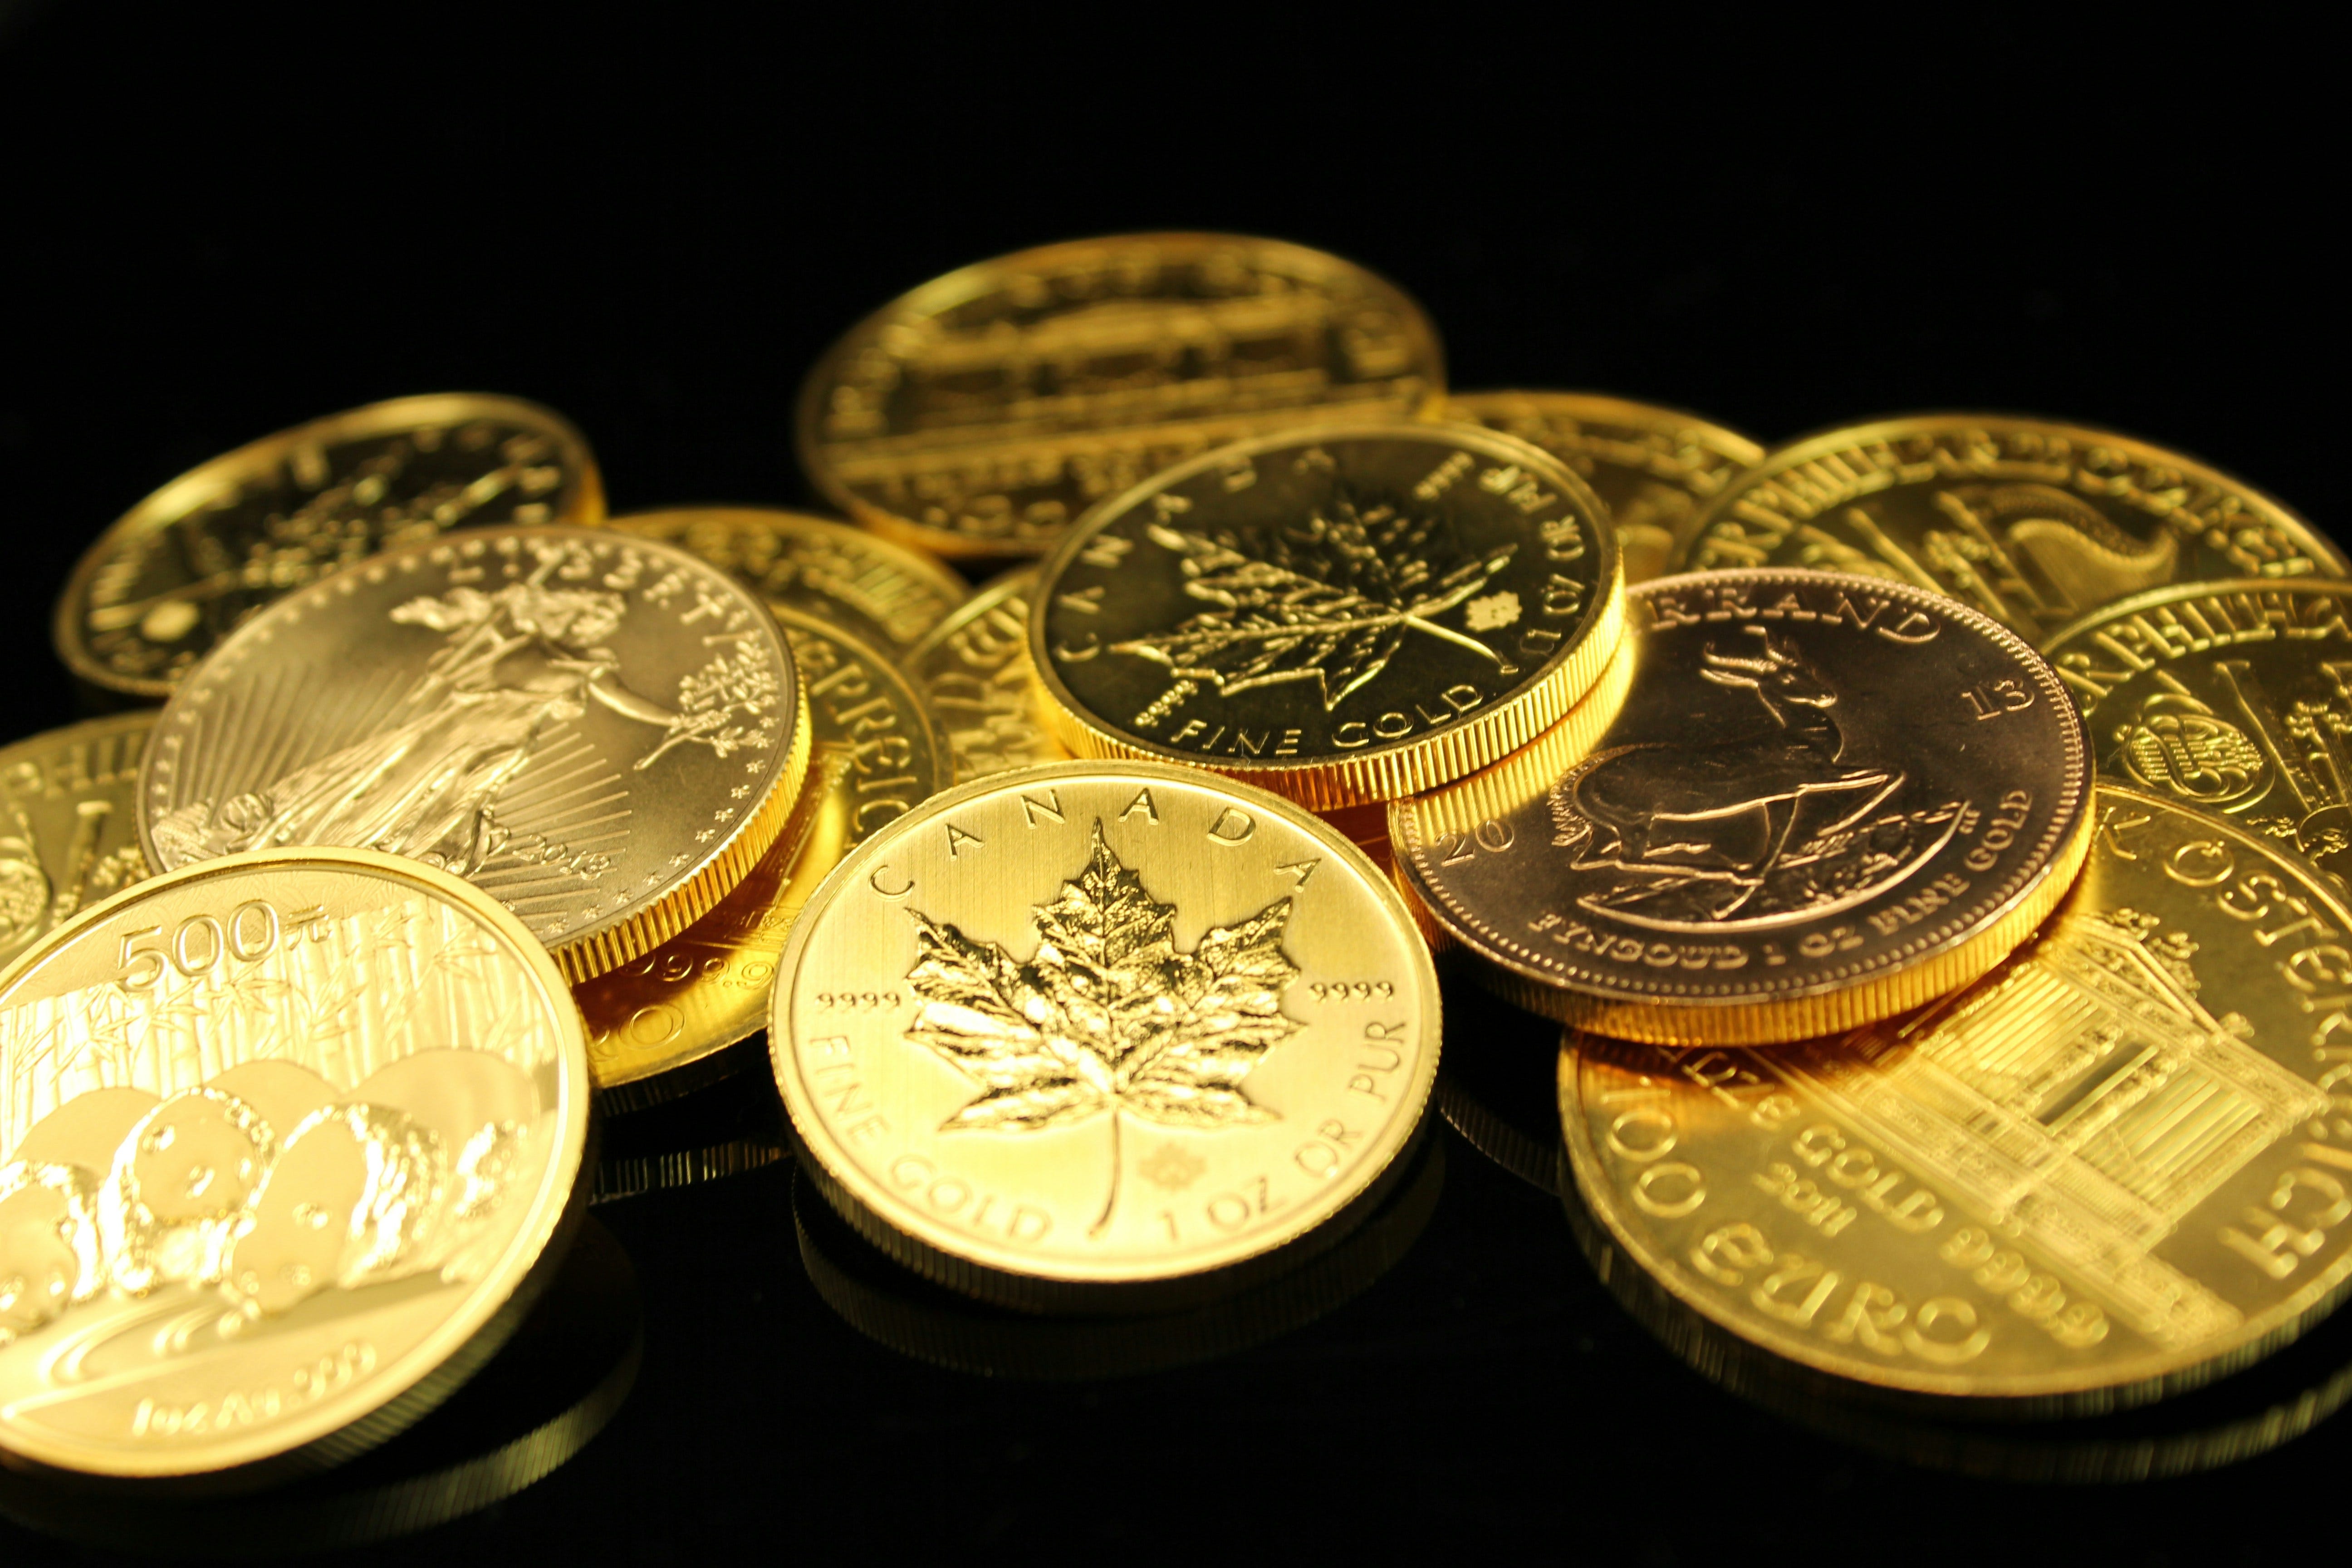
Gold is a chemical element that has historically been the premier form of commodity money because of its unique physical properties.
It is chemically stable and virtually indestructible, meaning almost all the gold ever mined is still in existence. This durability, combined with its geological rarity, gives gold the highest stock-to-flow ratio of any physical commodity, with new annual production consistently adding only about 1.5% to the existing supply.
This reliable scarcity makes gold a superior store of value, as its supply cannot be easily increased even when its price rises, thus protecting it from the debasement that has plagued other forms of money throughout history.
For a deeper dive into why we allocate to gold checkout the post below:

The Exposure
This exposure is one that we helped create and was inspired by our work in applied history.
Applied History
A practical tool that uses the laboratory of the past to better understand and navigate the complexities of the present and future.
We observed that Gresham’s Law states “bad money drives out good money” i.e. people rapidly spend the less valuable money and hoard the most valuable money.
For example, you spend in credit ledger money for consumption needs (like food) but save in commodity ledger money for savings needs (like gold).
We also considered a common criticism from fiat enthusiasts that gold does not provide a yield or income and is therefore less valuable.
Despite this not being the fatal defect that fiat enthusiasts think it is, we nevertheless considered this observation.
We ultimately merged these two observations into an exposure that we call “Gresham’s Wrath”.
It is a magnified gold exposure that also generates income.
Specifically, it is the combination of two different strategies:
First, we get 1.5X exposure to the price of gold. For example, if the gold price goes up 10% then this exposure would likely be up 15%. Economically, it buys $10 of gold with cash and then borrows the remaining $5 to buy the remaining gold position which results in a total gold exposure of $15. As institutional investors in global capital markets, we are able to borrow at an interest rate in the low single digits. Thus, we are economically borrowing a debasing credit ledger money whose interest costs are in the low single digits to buy a debasement resistant commodity ledger monetary reserve asset.
Second, we layer on the selling of put spreads to generate option income. This is akin to selling a fire insurance policy that lasts for 2 weeks before it expires for a price of $10 and then buying firestorm reinsurance for $1 thus pocketing $9 for the two week period. By renewing this “fire insurance policy” every two weeks we expect over the long term to generate a modest amount of additional income in a very prudent manner.
The Performance
Relative to the World Equity Benchmark
For the Quarter
It outperformed.
Relative to the World Bond Benchmark
For the Quarter
It outperformed.
Relative to the World Equity Benchmark
For the Year to Date
It outperformed.
Relative to the World Bond Benchmark
For the Year to Date
It outperformed.
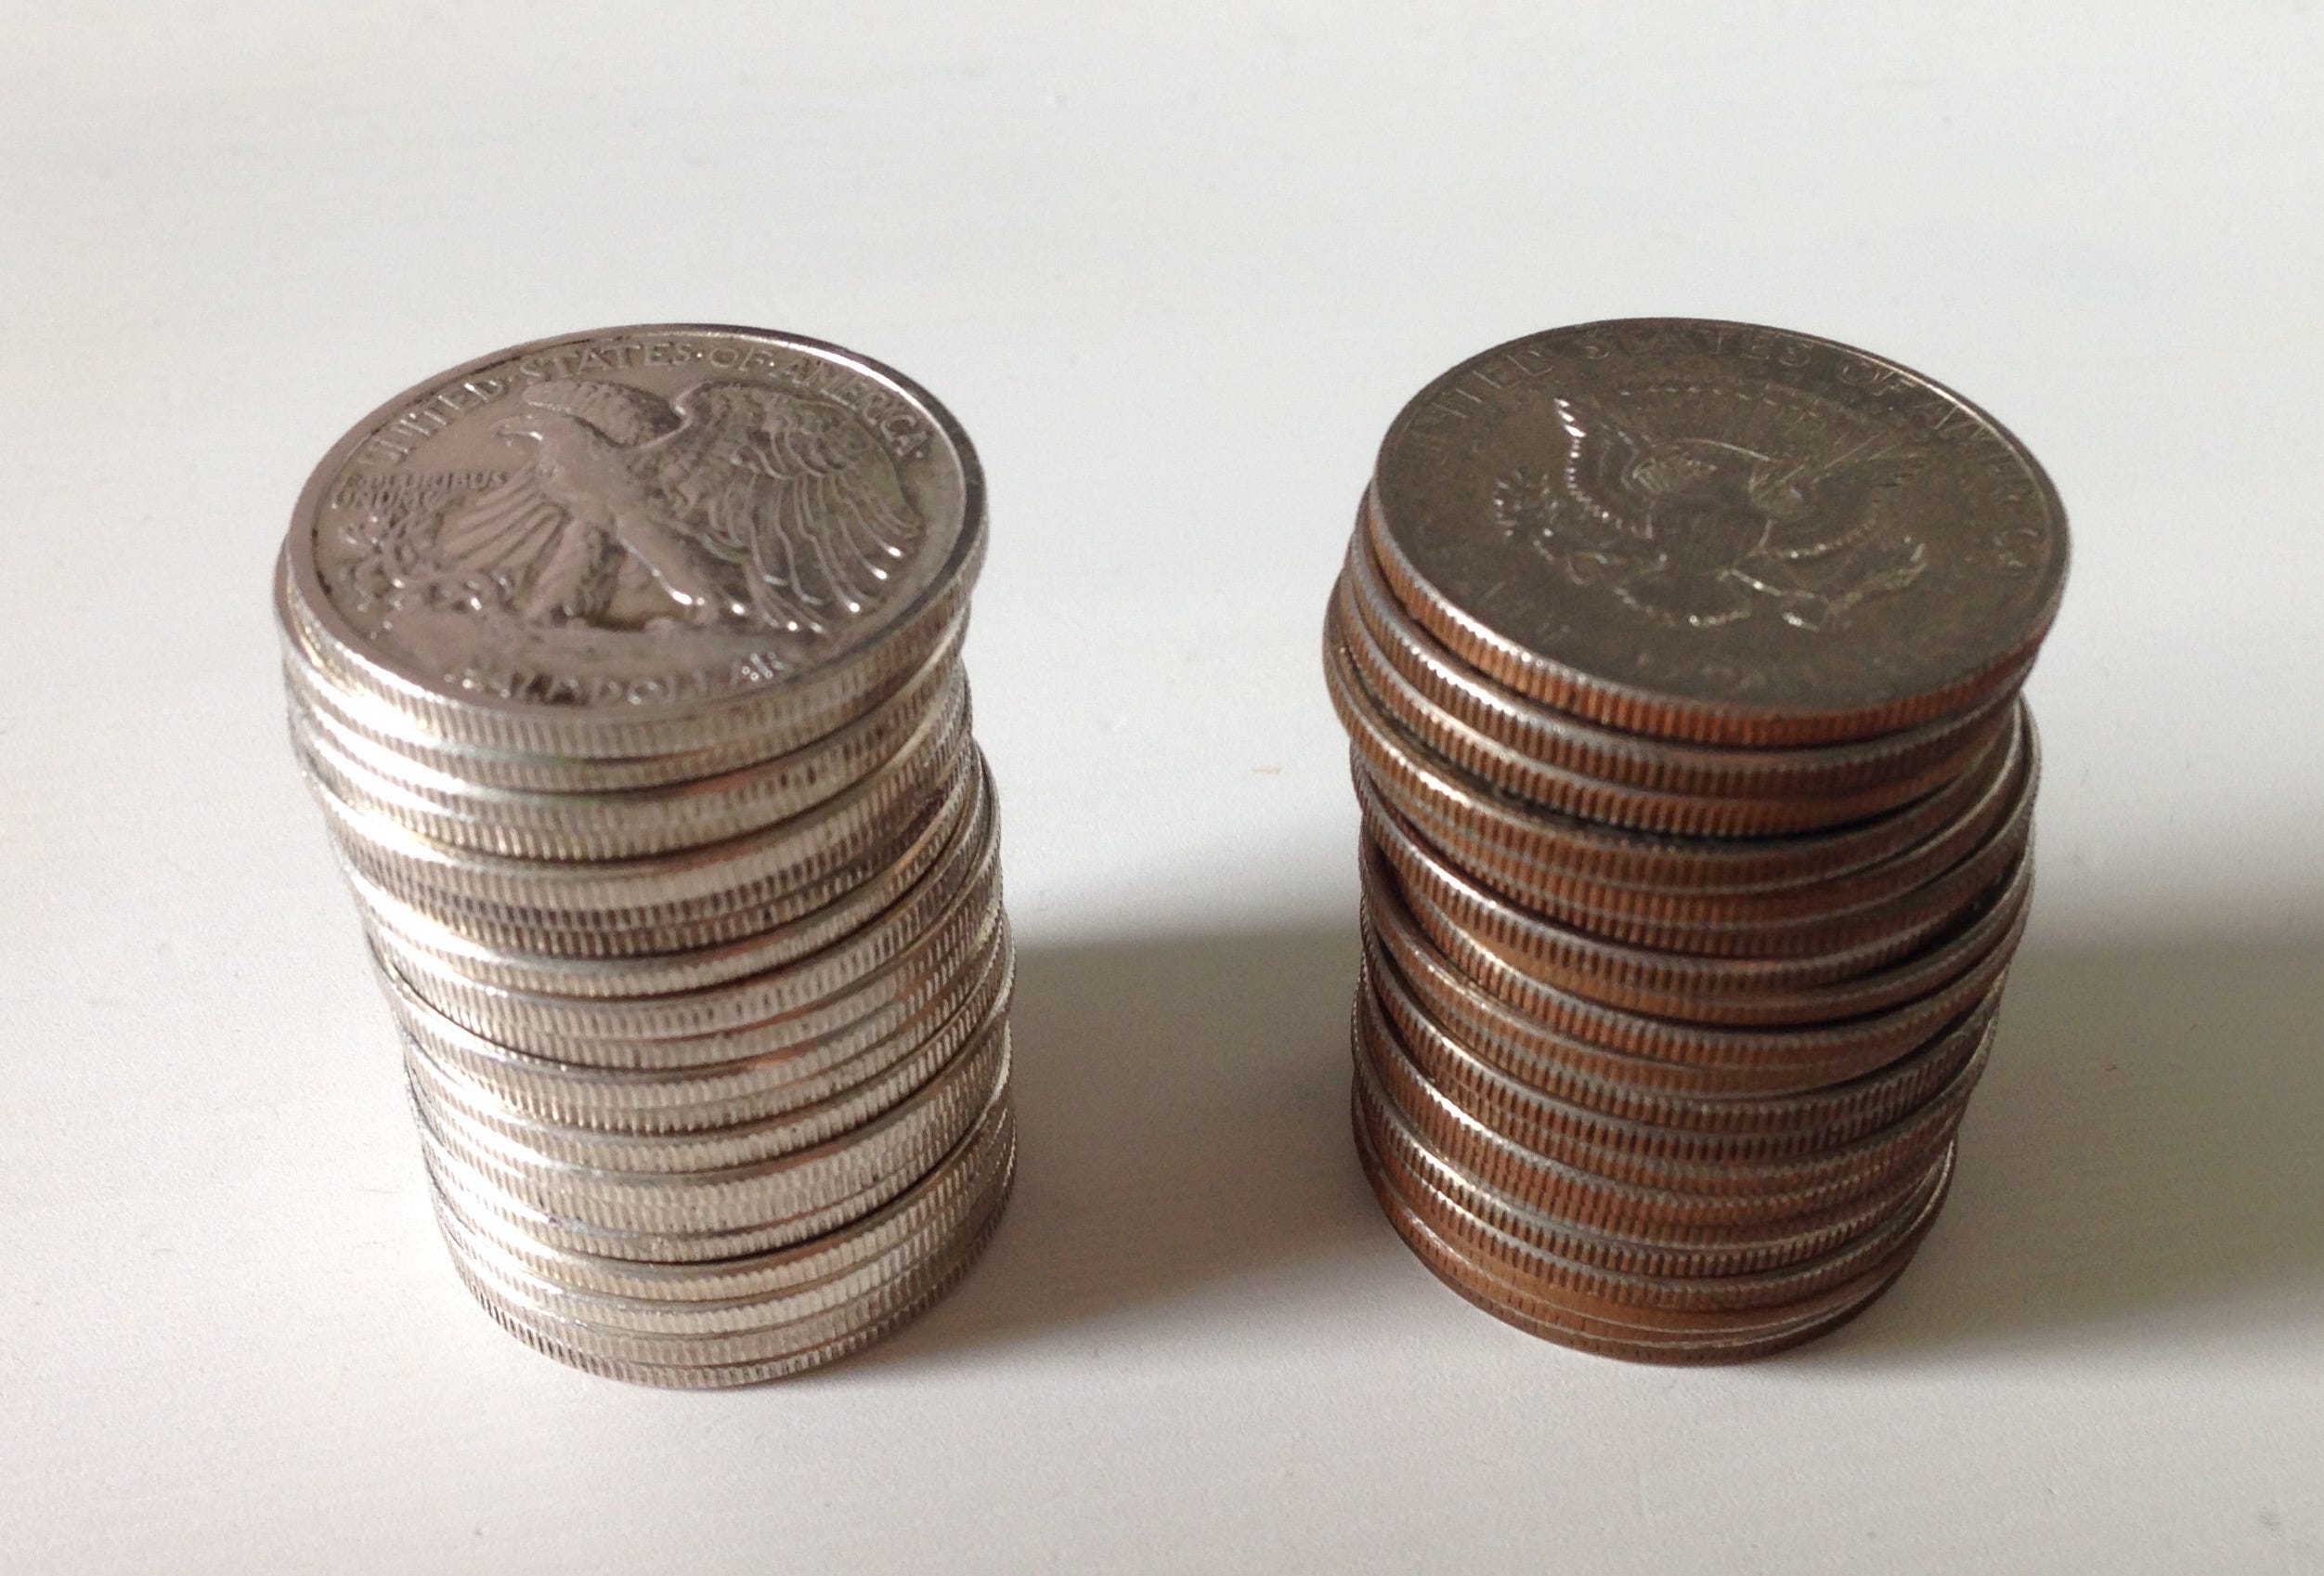
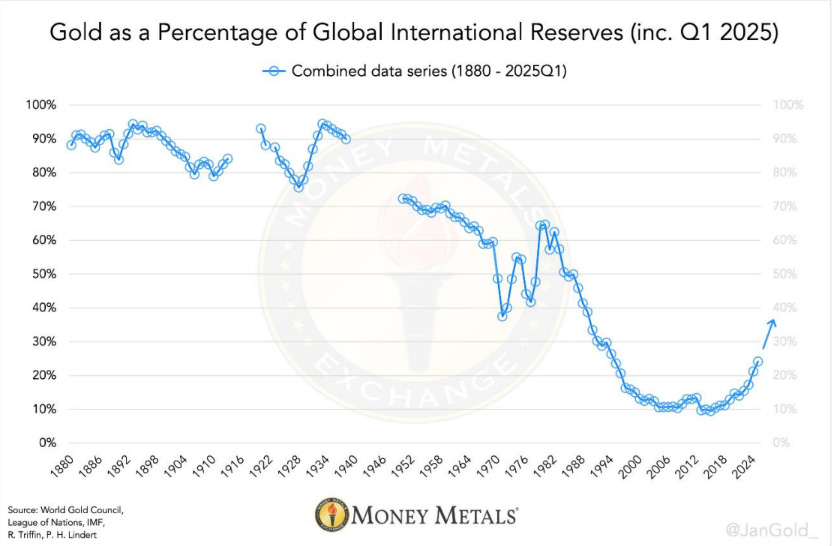
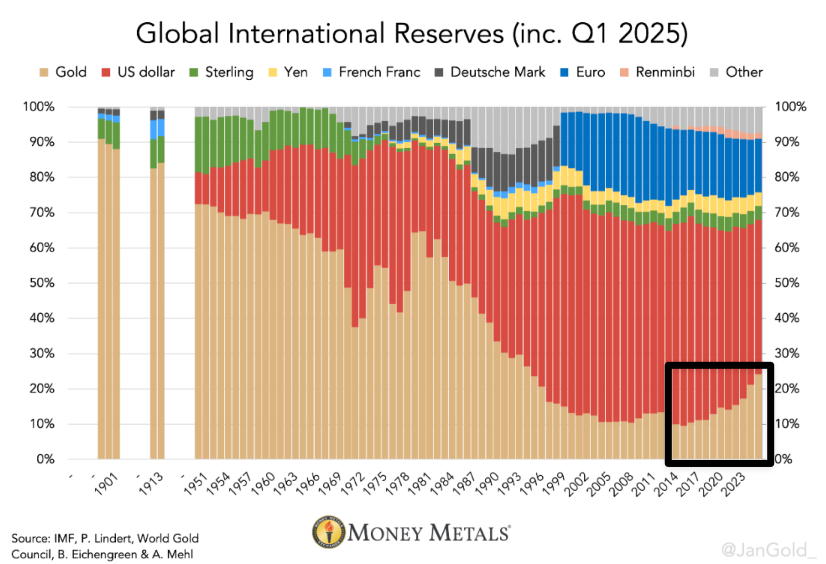
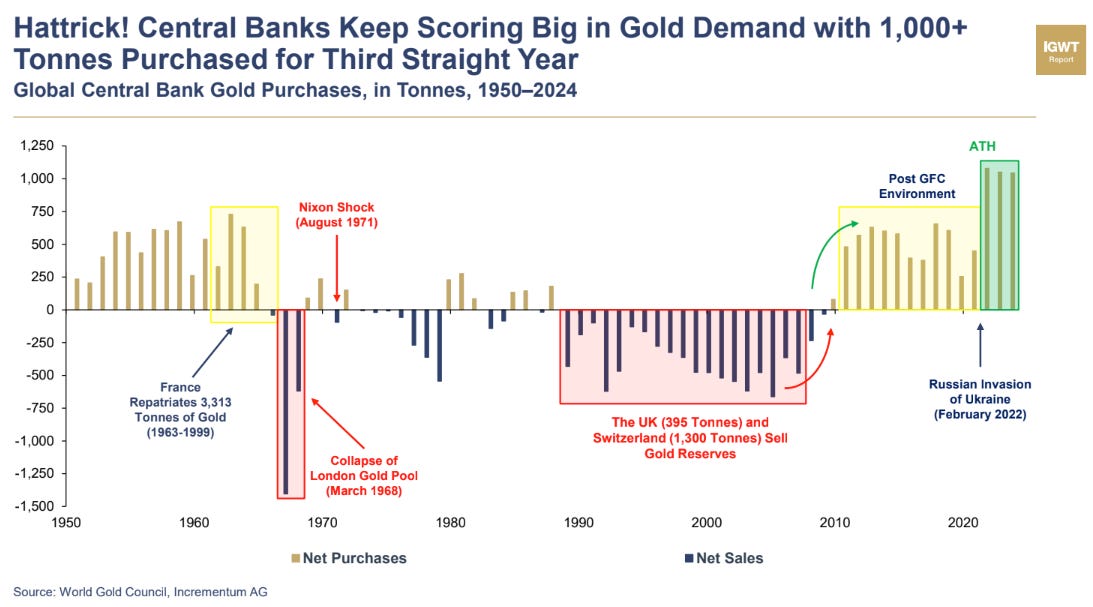
Fully Allocated Physical Gold Bullion
At the 50,000 ft altitude of analysis, you will see that
Gold demand from global central banks is accelerating at the same time US Treasuries are being reduced.
Gold demand from global central banks intensely accelerated after the start of Russia’s invasion of Ukraine.
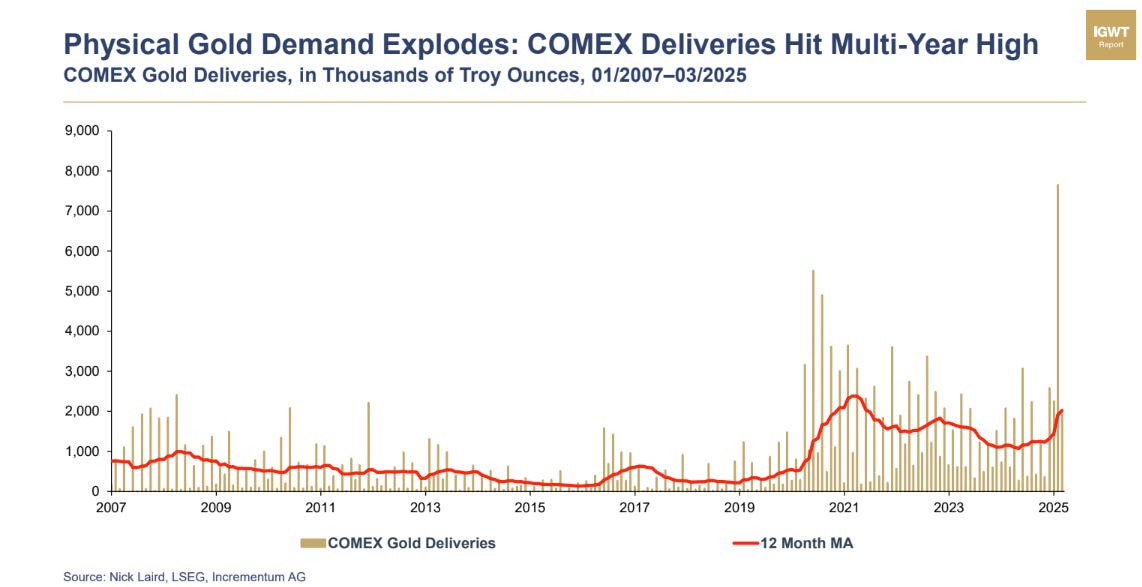
Gold exposure is being specifically expressed via physical deliveries which highlights growing mistrust.
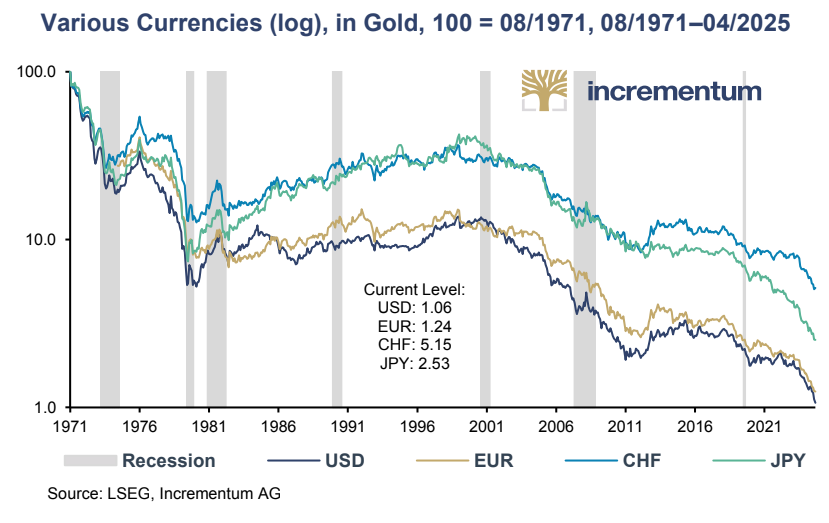
The top global fiat currencies (USD, EUR, GBP, CHF, JPY, etc) have all lost material value relative to gold once they were severed from the gold link in 1971. In fact, the best performing fiat of the Swiss Franc (CHF) “only” lost 93% of its value.
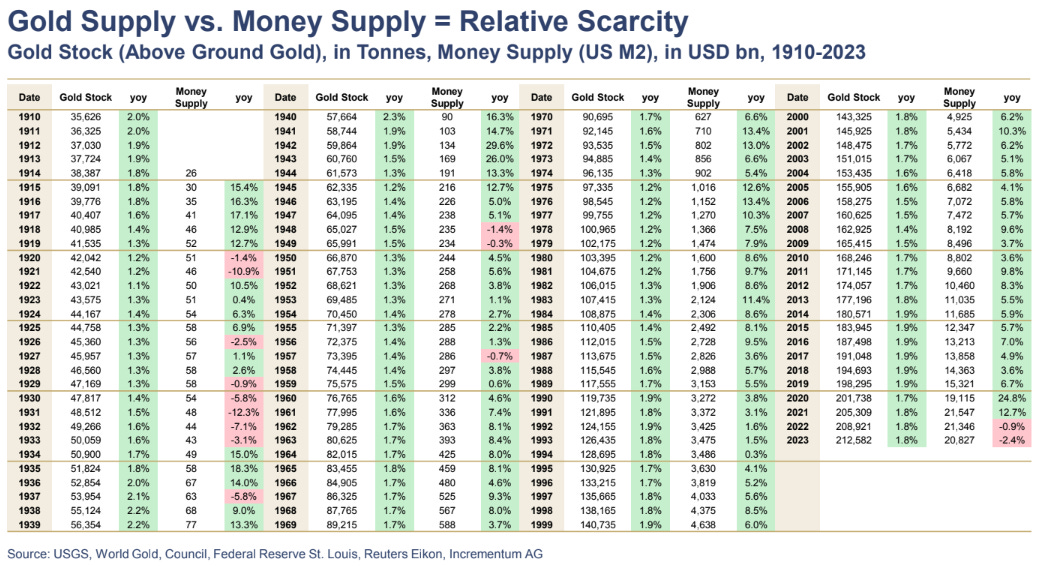
Over the past 109 years, the gold supply has increased from 38,387 tones in 1914 to 212,582 tonnes in 2023 which is an annualized increase of 1.59% per year which favorably compares to the USD supply of 26 billion in 1914 to 212,582 billion in 2023 which is an annualized increase of 8.61%. Thus, the real rate of annualized USD Fiat debasement is closer to the high single digits as opposed to the low single digits so commonly cited by fiat enthusiasts.
The Performance
Relative to the World Equity Benchmark
For the Quarter
It outperformed.
Relative to the World Bond Benchmark
For the Quarter
It outperformed.
Relative to the World Equity Benchmark
For the Year to Date
It outperformed.
Relative to the World Bond Benchmark
For the Year to Date
It outperformed.
New Positions
Foreign Exchange (FX) Strategies
The Summary
This seeks total returns thru a systematic approach in FX markets whose return stream has a low correlation to both stocks and bonds.
FX Investing 101
When you go to the airport and exchange USD for say Mexican Pesos (for that nice vacation you are going on) the Mexican Pesos you receive do NOT earn interest.
However, when you are an institutional investor who exchanges currencies in the Foreign Exchange Marketplace (FOREX) you have the ability to earn a yield on that currency you are buying depending on the instrument you chose to express the trade (foreign bills, bonds, FX forward contracts, etc).
Conversely, this means if you sell a currency you are effectively borrowing at the interest rate specific to that currency.
Ultimately this means as an institutional investor, you have the means to short currency A (and pay the interest rate tied to currency A) while taking the proceeds and then buying currency B (and earn the interest rate tied to currency B) thus earning the spread between the two.
Below is an example of combining multiple currency trades where you go long the higher yielding currency (lending rate) and go short the lower yielding currencies (the borrow rate) and thus collect the spread.
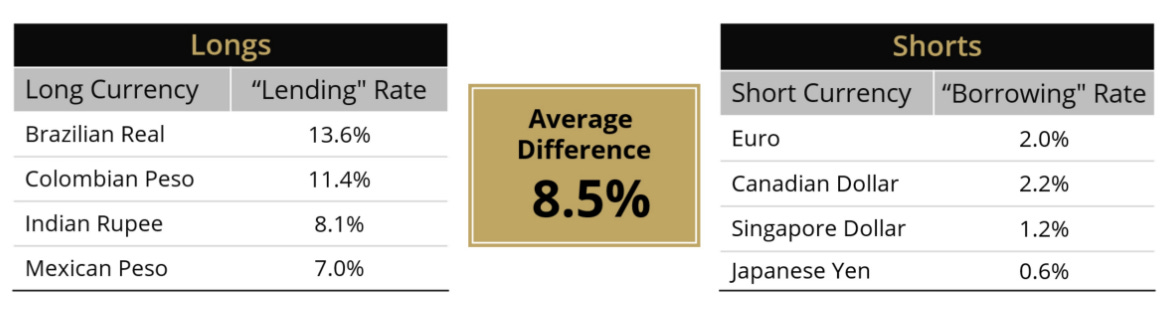
The Strategy
It primarily generates returns by capturing the “carry”—the spread between high-yielding and low-yielding currencies—by taking long positions in the highest-yielding currencies and short positions in the lowest-yielding ones.
This is done over 14 different currency pairs and uses foreign exchange forward contracts paired against the USD.
Because these trades require little cash outlay, the fund’s assets remain invested in US Treasury bills or equivalents.
Critically, it is USD neutral, meaning it maintains an equal percentage of currency exposure in long and short positions relative to the USD i.e. it is NOT taking a bet on USD relative to other currencies.

Disclaimer
This website is not an offer or solicitation in any jurisdiction in which the firm is not registered. Information presented is for educational purposes only. It should not be considered specific investment advice, does not take into consideration your specific situation, and does not intend to make an offer or solicitation for the sale or purchase of any securities or investment strategies. The services, securities and financial instruments described on this website may not be suitable for you, and not all strategies are appropriate at all times. Investments involve risk and are not guaranteed. Past performance is not necessarily a guide to future performance. Independent advice should be sought in all cases.
TYME Advisors is a U.S. Securities and Exchange Commission (SEC) Registered Investment Advisor . Registration does not imply a certain level of skill or training. Information about the firm including the Customer Relationship Summary is available on the SEC’s website at www.adviserinfo.sec.gov. Information about our privacy policy is located here.